Computational Fluid Dynamics (CFD) is a well-developed methodology using numerical computing analysis to examine and re-create issues that involve fluid flow.
 Markus Iuell, Lead Designer at HydraWell, explains what CFD is and where it is used...
CFD can be applied to a wide range of research and engineering challenges in many fields of study and process industries including Food & Drink, Aerospace and Automotive to Chemical Manufacturing and Energy sectors.
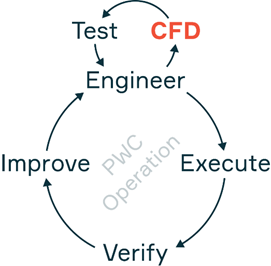
HydraWell uses CFD modelling to deepen our understanding about the fluid interactions that occur when using our technology. The three areas we apply CFD in our business are:
- New Technology Development Projects
- Operational Optimisation
- Quality Assurance
New Technology Development and Operational Optimisation
The qualification process for new technology requires rigorous understanding of the system performance being delivered in standard well conditions. For well abandonment technology, such as Perforate, Wash & Cement (PWC®), the infrastructure required for creating a representative qualification test includes, an onshore rig setup, casing that can be perforated and cemented as well as handling and disposal of environmentally harmful fluids. The process is costly and poses both Health, Safety and Environmental risks.
CFD is a tool that allows us to simulate otherwise complex tests and carry them out safely and efficiently, while generating significantly more detailed results. We can look at points of interest and gather information that would otherwise be impossible to generate from a single physical test.
It also enables quick and easy modification of the model geometry and/or operational parameters which otherwise would require machining of equipment or modifications of the test structure or fluid systems. This translates into flexibility when encountering challenges.
It allows engineering to carry out accurate and efficient design-optimisation by systematically investigating the performance of the technology at each stage of the PWC® operation, resulting in improved performance and operational efficiency.
This has been demonstrated by reducing the total time for a P&A operation from three days to less than a day, from start to finish. This translates into less CO2 footprint from operations and improved use of chemicals in fluids such as spacer and cement.
Quality Assurance
In addition to the advantages with regards testing and optimisation of our technologies and operations, CFD also plays a supporting role in the quality assurance of our PWC® operations.
Different approaches are being adopted among our clients to improve the qualification process by using a combination of conventional cement evaluation data, empirical data and CFD modelling. This combination allows for huge cost savings to the industry.
By gathering historical data from our operations, we can generate realistic models and adopt this to new scenarios, ensuring operational efficiency and consistent quality across all our operations.
In summary, using CFD together with the empirical operational data and physical testing have enabled us to deliver technology innovations, improve operational efficiency and quality assurance for the services that we deliver to the P&A industry.
How do we know that CFD is reliable?
The challenge with any modelling software is to ensure that it is as representative as possible towards the real-life scenario that is being evaluated. There are several considerations that should be made to ensure accurate modelling setup. These include:
- Choosing the right CFD Modelling Partner that has adequate theoretical expertise and practical understanding of well conditions so that numerical analysis is as close to reality as possible
- Determining the outputs that are to be measured or delivered, such that the model is setup to deliver quantifiable results that can be compared to operational results
- Quality Control of model parameters such as architecture, operational parameters, and fluid properties
- Comparing CFD results across different software and models
- Comparing CFD results with operational results (cement evaluation logs or pressure tests)
- Comparing CFD results to actual physical test data and industrial metrics
Our experience of more than 350 barriers installed and a database of physical test data has been used to compare CFD results with real operations giving us confidence that this methodology is both valid and robust.
Example
A recent example of the use of CFD modelling in development of new technology and optimisation of parameters is shown below.
Here, the cementing operation is being simulated to validate the operational feasibility for a given application. The model BHA consists of two main components: rotating jet nozzles (B), and an activated cement diverter (C). The cement diverter ensures that all the cement is diverted out of the perforations and into the annulus. The nozzles provide high energy jetting of the cement and generates turbulent flow in the annulus as it passes across perforations.
The effect of these two combined are the key features that enables good cement distribution across the entire cross-section. The example shows the final CFD feasibility study, as part of the quality assurance for new technology development. The final study is a result of design-optimisation through an iterative development process, with the goal to establish a homogeneous cement concentration across the entire cross-section of the well.
As seen in section D-D, the laminar flow of cement flowing up through the annulus is not sufficient on its own to provide an efficient displacement, and channelling occurs at low side (DL). In section C-C, where the cement diverter is located, the size of the channel has been reduced, but is still present (CL). Moving to section B-B, located at the nozzles, the cement concentration shows a significant increase. This is a result of the jets passing across the perforations, generating enough energy to replace the channel of spacer on the low side with cement. This effect can easily be observed by looking at the low side in the BHA cross-section where the transition from blue/green to red occurs. The resulting cement quality after the PWC® operation can be seen in section A-A. (Red = 100% cement).
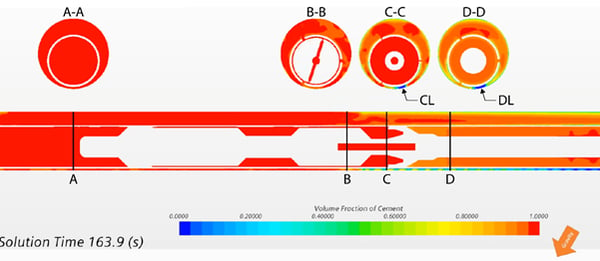
D-D: Above BHA – Poor quality cement distribution (channelling)
C-C: Diverter tool – Poor quality cement distribution, minor improvements (channelling)
B-B: Centre of nozzles – Good quality cement distribution (channelling being disrupted)
A-A: Below BHA – High quality cement distribution across entire cross-section
Well Abandonment Planning DOWNLOAD WHITE PAPER
KeyFacts Energy Industry Directory: HydraWell