
Which way would you go?
Two paths diverged in a rock, and I—I took the easiest - and that has made all the difference - or so the fluid molecule said (with apologies to Robert Frost).
The frustrating thing about the subsurface is that sometimes you will just never know what went wrong. You can’t walk up to the wreck of the crash and examine precisely what happened. Typically in the subsurface, when things aren’t up to expectation there are a number of options as to what is going on, and the “solution” to the question of “what happened” is emphatically non-unique.
In this article I take a look at permeability pathways, and how they can throw spanners in the works of stories we think are simple but aren’t.
One that got away
One prospect that got away in my career was a stratigraphic trap in Lower Cretaceous Britannia Sandstones of the “Kopervik” play (Figure 1, Law et al., 2000). These are lovely mass-flow sands, often thick, massive, and with great porosity and permeability (poroperm). At the northern end of the North Sea Central Graben the mature Jurassic source kitchens are busily cooking away close by (see Figure 2), sending oil and gas into the system and populating the “play” with numerous fields.

Figure 1: Aptian-Albian Prospect paleogeographic setting
Now stratigraphic traps are never without risk. They need their pinchouts to seal effectively along every part of trap. One leaky pathway is usually enough, over geological time, for it to go. There are caveats, if the rate of charge is greater than the rate of leakage, but that situation would be more exceptional. In the prospect in question, it looked like we had a reasonable chance of top seal from lower Cretaceous shales along the edge of the prospect. Never assured, but reasonable.
To cut a long story short, the well was dry, and being a stratigraphic trap nominally sealed by Lower Cretaceous shales, lack of seal was not unreasonably finger-pointed as the likeliest reason for failure. That might have been Lower Cretaceous ratty waste zones just silty enough to leak, or it might have been the base seal provided by middle Jurassic volcanics – something we now regard as much riskier than we did at the time. Either of those, or both, may well have been the reason for failure. However, the lingering thing which always intrigued me was the almost total water-wetness of the sands. Yes, there were some faint sniffs that – well you know – in any post well discussion are always elevated to a status of hydrocarbon shows – but it was remarkable how little hydrocarbon there was. That intrigued me. Where were they?
This was, at the end of the day, in all probability a seal failure (see Figure 2). Nevertheless, why so few hydrocarbon indications, given the presence of nice sands typically in the 50-1000 mD bracket, and about 150 m thick proximal to the prospect, with a nice working kitchen also almost directly down dip. Surely even if there had been a seal failure, the sands were good enough for at least some hydrocarbons to have made it the way of the well.
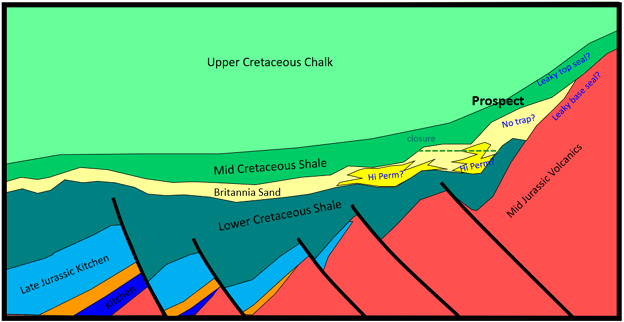
Figure 2: Prospect cross section
Apparently not…
Therein lies the rub though. We often tend to look at things in absolute terms and see a lovely big chunk of good porosity good permeability sand, with a nice big volume of mature source kitchen nearby, and think, well even if it leaks, the hydrocarbons are going to pass through this way.
That however is not how the migrating fluid sees it. For those molecules, they don’t get an advance picture of the seismic volume seeing which way to head for in advance. Each step of the way is an instantaneous Boolean decision between a molecule going this way or that way (Figure 3). If one way is 2000 mD (very good permeability) and another is 200 mD (still good), then there is no competition. Off on the high-perm route it goes, even though the other is still good.
There are complications to that of course – “wetness” of particles – chemical bonds luring the fluids - ensures water in particular is entrained along the edges of grains eventually almost everywhere in subsurface rocks. Rocks like having water for a molecular next-door neighbour. They welcome it in for a chat and a cuppa almost everywhere over geologic time. New fluids though, not in solution, being introduced, hydrocarbons, gases, don’t get that, not to the same extent anyway. For them, squeezing through the pore throat is king.
The point is that the dominant flow for any fluid is not conditioned by the bulk properties of the rock, but by the pore throat detail, and “entry pressure” into that pore throat at each juncture. That’s a lot of detail to capture in accurately predicting fluid flow at small scale. In fact, an impossible amount of detail. So, we do the best we can, realising it is not perfect (hopefully).
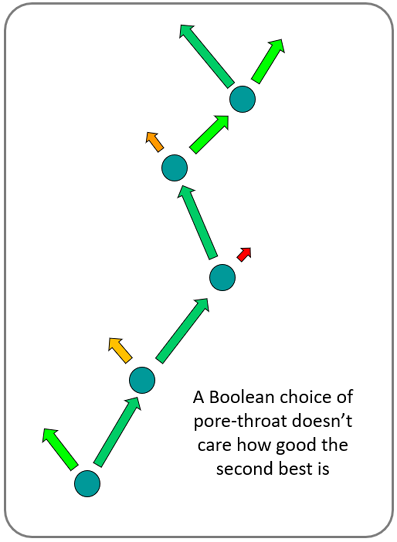
Figure 3: The Boolean choices a migrating fluid molecule "sees".
It is the blessing and the curse of the high-perm pathway. If there is a consistently very good pathway in existence that fluids in the subsurface can “see” as they move along, then all those “good” ones might as well be a slab of concrete, as long as the very good ones remain accessible and not full up.
It’s not unlike the traffic analogy really. The UK is blessed with high quality roads all over the country, but when we set off on a journey, we are looking for the best road, least clogged route we can find. That will often mean the motorway. There may be all sorts of A road and B road combinations that will take us to where we want ago, roads that are perfectly up to the task, but no, we come to a junction, and always take the easiest one. If that’s a choice between a motorway and a good A-road but with roundabouts and traffic lights and junctions, then we choose the motorway (see Figure 4). As long as we see it is clear, that is. And as long as our motor has some oomph in it – be it petrol or pressure.

Figure 4: Motorway or A-road. What about in a traffic jam?
Same for fluids in the subsurface really, they pick the best, easiest route, even if the others are still very good. The time when this might change, is, just like a traffic jam on the motorway, if things get clogged up ahead. Then we may well find it easier to hop off the slow-crawling motorway and back through the off ramp, roundabout, and traffic lights, onto the A-roads. Not before though. It’s as if every time a fluid molecule travels through the subsurface, it is instantaneously coming to a junction choice – a junction with a traffic light of sorts – not just red, green and amber, but options with a spectrum of red, green and amber hues, and the choice made is the greenest one at each juncture. Unless the rear brake lights of the fluid vehicle halting up ahead tell it to take another route. Or unless it runs out of fuel.
And another thing – chalk and cheese…
The other thing that was always notable in the North Sea was the controlling influence of the chalk on overpressure in the basin. “Overpressure” is what we call the difference between the pressures we would normally expect from a column of water above, and what is actually observed. If there is a big difference, it signifies that the liquids are constrained from escaping in some place and are having to bear a portion of the lithostatic load – i.e. from the much heavier pressures from an overlying weight of rock. It’s the difference between standing on a wet sponge and standing on a wet sponge that has been tightly sealed in a plastic bag. You can imagine the fluid in the latter is a lot more pressurised than the former – because it is bearing some of your own weight, whereas in the former it doesn’t have to – it can happily drain away from the pressure point.
That also has profound implications for how we look at rocks. Pressure data from hundreds of wells around the deepest most overpressure parts of the North Sea consistently show a pressure ramp occurring through the chalk (see Figure 5), separating normal hydrostatic (water loaded) pressures and more moderate overpressures above, from far stronger ones below it, in the deepest parts of the basin. This is where shales are compacting and releasing water at depth, pumping up the pressures in limited void space between rocks bearing the lithostatic load from rocks above. If the water can move freely to the surface through the sediment, it does so, and this pressure doesn’t build up. If it can’t evacuate though, the pressure continues to build. So, when this happens it implies a blockage from above.
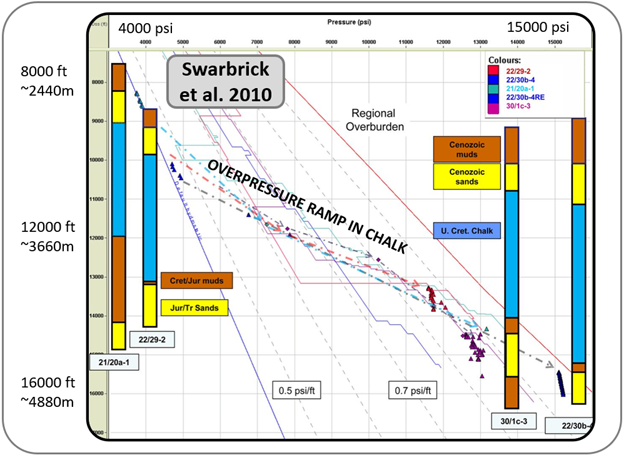
Figure 5: The overpressure ramp observed in North Sea Chalk
The fact that this blockage occurs mainly at the chalk is interesting. We see the pressures mainly ramping up at this location. The reason? Chalk is made originally of tiny calcareous coccolithophore “shells” which pack tightly and leave little original permeability to start with, although still retaining a lot of porosity – i.e. gaps between particles but not very connected ones. These very fine, tightly packed particles in carbonate rocks like chalk are also much more chemically dynamic than shale rocks at these pressure and depths in terms of dissolution and re-cementation.
In other words as they are squashed by immense pressures and heated, any porosity they had in original depositional rocks is impacted by new cements filling in the voids and blocking pore throats and reducing permeability. Processes like pressure-solution are vigorous. Bits of the rock that are slightly harder and more difficult to dissolve squeeze hard against softer bits under elevated temperature and pressures, and the softer more easily dissolvable bits of the rock get out of the way and reprecipitate locally. Not unlike shoving one’s way through a crowd really. Not that I would ever be so rude...
Other sediments are not immune from this effect, but carbonates are especially disposed to it. They may fracture and crack just as much as other rocks during deformation and other processes, but this chemical dynamism means any permeability associated with those fractures “heals” better with time, and chemically compacts the rock. In truth chalk is much more varied in nature and there are permeable units within it too, but large swathes of it are not. Mallon and Swarbrick (2008) talk more to the issues.
This pressure ramp observed in the chalk layer, above so many of the North Sea’s many sandstone reservoirs, is also notable for where it doesn’t happen. For between those deeper reservoirs – often Jurassic, or Triassic in age, or the lower part of the Lower Cretaceous, there is almost always a thick sequence of Lower Cretaceous shales. What we don’t see, as a general rule, is the pressure ramp continuing there. That means, the deep dewatering of shales at Jurassic and Cretaceous levels is happily finding its way to the base of the chalk more or less unencumbered. The shales, much as we think of them as a seal, are not stopping the overpressure migration on a geological time scale.
Sometimes when overpressures get great enough – and they will if they are steadily building in a place where they can’t escape, they become great enough to exceed the tensile or shear strength of the rock and then fracturing forges a path, cracking through rock from the regions of the very highest overpressures. That is, until they reach rocks with a higher strength and then the process stops again until overpressure can build up again to exceed the new barrier strength.
That we only see the pressure ramps building in the chalk has implications for the underlying shales between chalk and the sandstone reservoirs. It means, to some degree they must be permeable. These clay rich sediments themselves aren’t very inherently permeable, so the most likely explanation is that they are sufficiently fractured and to allow fluid and pressure migration sub-vertically along those routes – almost pervasively when looking with large scale “fuzzy glasses”.
A bit of an aside…
The interesting corollary for hydrocarbon exploration in high pressure high temperature prospects in the North Sea is that it may be less the structural relief of the top reservoir that matters ultimately than the structural relief of the base chalk. Lots of caveats to that, but as a rough rule.
For sure the structural relief of the top reservoir is important because the reservoirs allow the highly overpressured fluids from deeper down, to migrate higher along them, to places where the confining pressure of the rocks is lower, and they can potentially “breach” at the highest, crestal point, busting through with fracturing as the pressures become great enough.
Interestingly though, virtually all the really high temperature high pressure big fields in the North Sea, have evidence of this leakage from the crest – it is as if it is ubiquitous for such structures – and not necessarily the death knell of a prospect by itself. However, there may be a natural damage limitation exercise acting - such that when the process gets to the chalk it is halted. So, the fractures up to that point might fill up with migrating fluid, but their relatively small volume doesn’t stop an accumulation forming below.
However, those structures which also happen to be below high points in the base chalk are less lucky, because they are the locations where eventually the chalk may breach first too, as pressures build, and so fluids can escape right through to above the chalk and beyond. From there laterally extensive sands can redistribute them into Tertiary fields, and along penetrating structures to the surface.
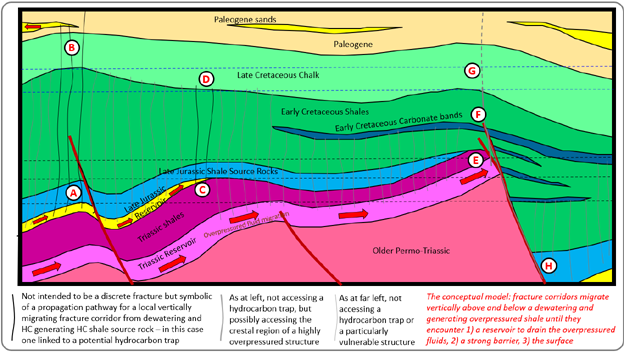
Figure 6: On the non-intuitive corollaries of overpressured fracture high perm pathways
Figure 6 illustrates some perhaps non-intuitive implications of a simple conceptual model. In it we ignore, for now, fractures originating from other shale units - but envisage some fracturing is produced within the late Jurassic source rock shales. This, as a result of overpressure from both in-situ hydrocarbon generation and compaction related to dewatering of sediment under pressure. We assume these fracture “corridors” (signified by lines on the figure, but in truth far more complex), travel sub-vertically in both the upward and downward directions – away from the overpressure inducing them.
In this simple model, they stop propagating only when they encounter a reservoir unit that can drain away the overpressure, or a different lithological unit that is far stronger - which the overpressures cannot penetrate until they build up some more. It’s worth noting that such fracture corridors are inherently more likely to propagate upward than downward, because confining pressures increase downward but decrease upward, so the higher these deep overpressures ascend, the more able to overcome rock confining pressures they are, until they hit a stronger barrier. These corridors can propagate downward too, but will eventually hit a limit where the confining pressures are strong enough to halt them.
This upward propagation of overpressure is similar to what can happen in a hydrocarbon well blowout. If pressures from a deep reservoir find a way around the internal pressure controlled parts of the borehole, and into the fracturing rocks around it, or into higher level reservoirs (that are less confined and which haven’t been adequately isolated by they well’s design in the way they normally would, because one of the reservoirs was a surprise) - then they can make it all the way to the surface (Figure 7).
If you’ve never seen them before these videos can give a good sense of the kind of pressures being dealt with:
- https://www.reddit.com/r/CatastrophicFailure/comments/au9pfo/workover_rig_blowout_blows_tubing_out_of_hole/
- https://www.youtube.com/watch?v=rhZKUYVXM78
Bear in mind in the first video that spaghetti like stuff you are seeing flying into the air is steel tubing being shot out of the well, and that in the second, that foaming sea is not weather, it’s gas leaking through the rocks below and finding its way to the sea surface. These pressures are big, and they are down there.
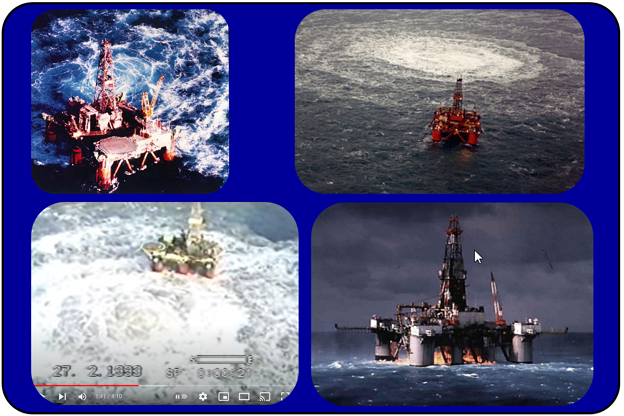
Figure 7: I don't think it's supposed to do that…
Some simple model non-intuitive corollaries
When we talk of a pressure “cell” in the subsurface, we mean a subsurface compartment of rock of similar overpressures, confined by some lateral barrier at their edges – be it lithological, or structural, like a big fault, but communicating laterally along reservoirs within them to some degree.
In our simple model of Figure 6, we assume lateral communication of overpressures is limited within each pressure cell, except at those reservoirs. If we adopt such an admittedly simplistic model the surprising thing then becomes that the deepest reservoir structure at A is most vulnerable. Why? Because the barrier that stops the fracture propagation – the base chalk, is highest there. That means it is where the eventual build-up of deeper pressures will be most likely to overcome confining pressures and breach through the chalk at B, draining not just the fractures, but any accumulation below.
In other places, such as C, the overpressures may well overcome confining pressures and breach in time before the structure at A does – because it is shallower. However note that A and B are in a shared pressure cell. The leaky fractures from C however, reach D and then pause. The hydrocarbons have leaked into the fractures, yes, but as long as there are no laterally continuous draining reservoirs in the early Cretaceous section (there will be some small ones), this represents a small volume, and once stopped, the ability for accumulation to continue below as hydrocarbon charge keeps going, still exists. Between C and E note that intervening thin carbonate bands may also be all that is needed to pause fracture propagation.
Note it’s not thickness that stops the migration. It’s the conditions where those fluids meet the rock. The pore-throat entry pressures. There is a caveat in that thinner they are they more likely they are to be broken by other processes like small scale faulting – that’s why in practice thinner seals are riskier - but in theory, the migrating rock doesn’t see the thickness of “seal” above, just the conditions at its contact.
At structure E, we are at the structurally highest reservoir structure, but it is still in Triassic units some way below the generating and dewatering Jurassic shales – so maybe the overpressures will be less. Let’s for a moment though assume different, and that the overpressures are greater because they access fluids from the very deepest Triassic reservoirs and overlying Jurassic shales. If so it might be the first in time to “pop” at reservoir level - but again the base chalk at G is at the same depth and confining pressure as D, so as long as it is in the same pressure cell as B, it would be protected from “breach”. That is because B would go first, and when it does, it will potentially relieve pressures in the whole cell and protect other structures from breach. . The story is different if the major fault at H to F accesses even deeper pressures in the deep adjacent basin. Then the local base chalk crest of that pressure cell does lie at G, and breach becomes a risk.
So what? The takeaway from all this, is that looking at a gross scale, we see the reservoir distributions and we might map their top and draw conclusions based on them. However those subtler fracture corridors, high permeability pathways, are inherently smaller structures but in even a simple model like this, they totally change the sealing potential of structures in the basin. These high permeability pathways rule. We don’t always incorporate them or even consider them qualitatively in our analysis as we should.
Actually…
It’s more complicated than that of course, and Grauls 1999 completed a nice summary of many of the different mechanisms and factors than might influence overpressures and associated fracturing (Figure 8). For all those of you for whom Mohr circles give nightmares I apologise in advance but they are an elegant way of describing what can happen (Figure 9). Go back to the original Grauls paper if you need a refresher on what it all means, but the upshot is - rocks adjacent to dewatering or generating shales (or for that matter rocks doing any manner of things) fracture a lot and are influenced by a lot of different processes. That makes rock fracturing hard to predict and frequently almost pervasive. Some of the fractures we see in rocks at surface outcrops are related to being exposed at shallow depth in the first place – that release of pressure allowing joints to form as rocks are uplifted and exposed at surface - but equally, many aren’t – they formed deep down. Any geologist will vouch for the almost ubiquitous nature of rock fracturing, especially in less permeable rocks.
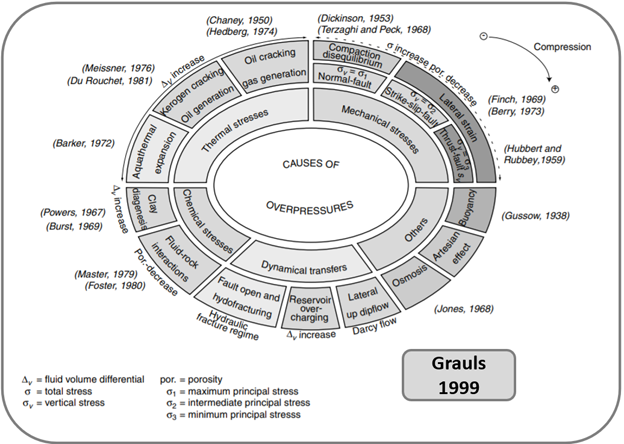
Figure 8: Overpressure and fracturing - it's never quite so simple...
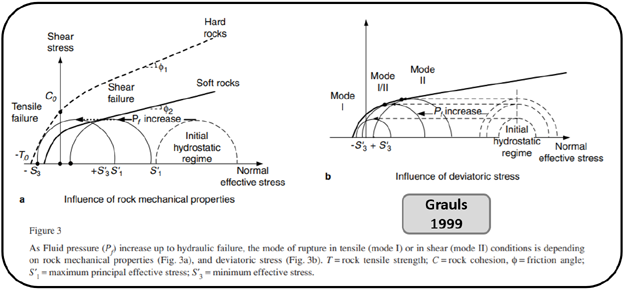
Figure 9: Left wanting for Mohr…
The importance…
The implication of this permeability pathway issue is profound, because it means that when it comes to porosity and permeability we know longer have to just map where volumetrically it is good, we need to model the linear trajectories of where it is best. That is much, much harder, essentially impossible at a detailed level.
This isn’t just an issue for hydrocarbon migration, it has profound implications for lots of things. Importantly of course, for storage underground of gases. The ones that come most frequently under discussion these days are carbon dioxide (CO2) for CCS or hydrogen (H2) for storage. They are less dense and more mobile than hydrocarbons. It is important to consider this permeability pathway issue because if we are now talking about the need to pinpoint where the best permeability pathways are and not just the good ones, it becomes a much harder proposition. This because – especially if fractures and faults are involved, the best permeability pathways may be quite small in volumetric extent, and so much harder to detect. This is especially significant given evidence from North Sea overpressures, that even lithologies we normally treat as “sealing” like shale, may be so pervasively fractured as to be effectively permeable on geological (or maybe even shorter) time scales.
On the upside, we can take more comfort, if there are sealing rocks above which are “dynamic” either physically or chemically, and so more likely to undergo inherent in-situ changes that continually enhance and refresh their sealing ability. Carbonates at sufficient depth to experience various chemical changes – including mass redistribution through dissolution and cementation - are one we have already discussed – but evaporites, and particularly halite (rock salt) are another even better one. Below a few km they deform ductily in such a way as to anneal any short-lived internal fractures, destroying porosity and permeability and inhibiting fluid migration significantly. Note that even they can still fault – it’s the old experiment of hitting silly putty with a hammer – it cracks because of the short sharp impulse delivered. Push in with your finger though and it will simply deform without cracking. Evaporites are like that, they can crack, but they deform ductily and heal very soon after, destroying any newly created permeability very quickly.
Not just hydrocarbons and gas storage either…
Mineral precipitation and geothermal applications are equally impacted by whether high permeability pathways exist or not.
If we are exploiting geothermal energy through the use of a “doublet” – a producer well and an injector well (Figure 10), then ideally what we want is a fairly homogeneous distribution of porosity and permeability so that the injected water travels over a fairly broad area, absorbing the heat flow from that broader area. Because it is doing so over this wider area, it also does it slower, spending more time in the subsurface to “catch” the heat flow incumbent on that larger area. We want that. Just as how a river slows when it widens, and speeds up in the narrows.
So, if we have a doublet that just happens to tap into a particularly high permeability pathway, it may be a problem – because it then focuses the fluid flow along that narrower pathway, and accesses less areal heat-flow, and spends less time travelling between the wells to pick up the heat. It’s a balance, because we want and need some permeability – but when it comes to perm', we can have too much of a good thing. Widely distributed permeability is the ideal for this purpose.
For mineralisation too (Figure 11), it matters. The chemical reactions and their intensity can vary according to speed of travel from one set of PVT (pressure-volume-temperature) conditions to another. If a hot fluid rich in a mineral solvent slowly ascends percolating through widely distributed permeability and porosity, the nature and distribution of the mineralisations that occur may be very different to high-perm pathway ascents. Those that happen with a hot mineral rich fluid streaking suddenly up a volumetrically limited high permeability fault or fracture and then abruptly encountering cooler fluids at some much higher level.

Figure 10: Hi Perm pathways and geothermal - aquifer doublets and hot dry rock (HDR)/EGS fault & fracture systems
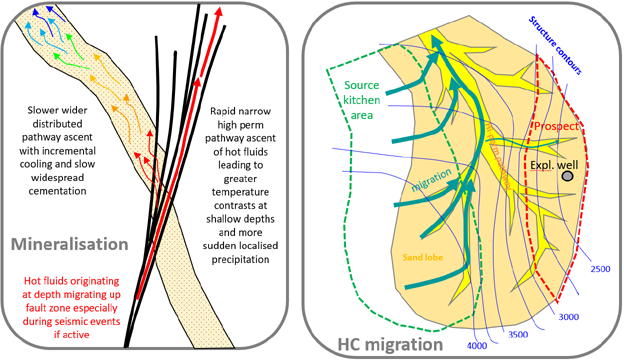
Figure 11: Perm pathways in mineralisation and hydrocarbon migration – some example complications
Averages versus maxima and minima
In summary, searching for an average is very different to searching for a maximum or minimum. The average is a characteristic of a large volume. The maxima and minima are what drive threshold-limited systems and they are intensely more localised. Permeability pathways represent an example of a local maximum-driven system. Finding, or modelling those local maxima and minima in a given location is a far harder proposition than estimating an average over a much bigger volume. That makes prediction of subsurface fluid migration, hard. For some things averages are absolutely what we want to know. For delineating fluid migration in the subsurface, amongst other things, it ain’t (Figure 12).
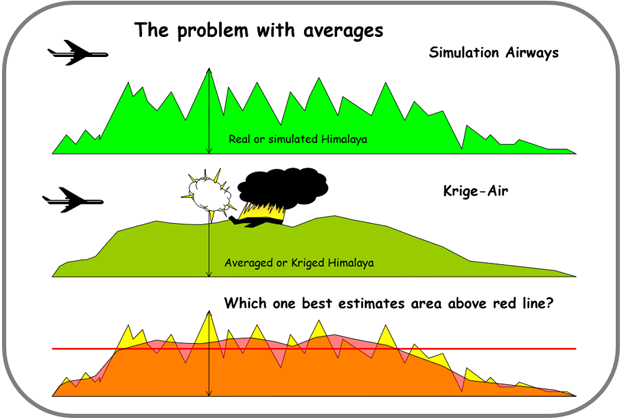
Figure 12: When the average isn't what you want to know.
What about geostats?
There are improvements that can be made. Geostatistics is very good at understanding the variance inherent in data sets and modelling simulations which replicate that variance - to produce maxima and minima (Figure 13). They do this in models that are still imagined, not actual reality, but they are models which preserve as much as we can know about the variance – the character of variability – within a system. Yet they are always models and we never really know where the real maxima and minima are. Neither do we really know that the data sets we have used to derive our variance models are truly capturing anything near the real maxima and minima in a volumetric data set.
The perpetual problem in geology is that we only ever directly sample a most minuscule of minuscule proportions of the subsurface. We pick a flower from the jungle and make conclusions about its entire botany. Geophysical methods aim to see a wider volume, like the aerial shot of the jungle, but they always do so imperfectly, as through mist or patchy cloud.
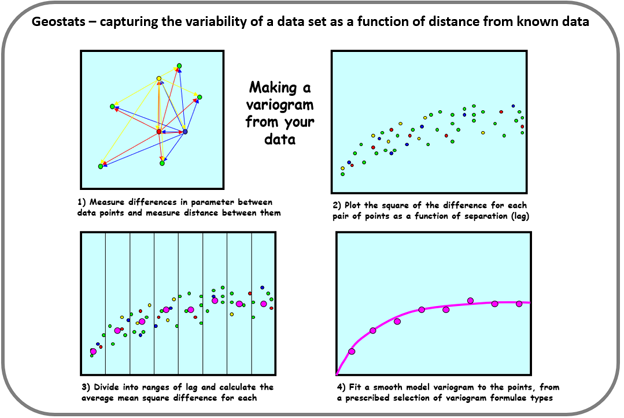
Figure 13: Valuing the variance
The question of time
The strange dichotomy of geology is the vastness of time which it samples, yet when we view it from that perspective it is possible to forget how much of it is formed very quickly in almost momentary events. When we talk about permeability pathways, this is also of critical importance – especially if we are talking about things like gas storage.
Suffice to say the element of time in the subsurface remains one of the most poorly understood aspects of fluid migration at scale. We see things happening in wells when we incur unnaturally large pressure differences between the deep subsurface and the atmosphere, but what normally goes on when they aren’t there? The systems we can observe in wells are immediately artificially disturbed ones. So, a lot of questions remain. How quickly does oil and gas migration or mineralisation occur? How smoothly, and how punctuated by sudden events? We are still learning.
4D seismic, that is to say the practice of taking time-lapse geophysical snap shots of the subsurface - is starting to help us understand some of these questions, and it can be startling how quickly changes happen. Some of the fluid redistribution observations from the North Sea Forties Field over the years, for example have been startling (Singer et al 2018). Admittedly they were likely induced by production changes in pressure at wells, but they signal an environment in the subsurface that is much more dynamic than we often suppose.
Really this shouldn’t surprise us – going right back to the Kern County Earthquake in California in 1952 , we’ve been aware that single earthquake events can shift huge amounts of fluid in a single event (Muir-Wood & King 1993). The Lusi/Sidoarjo mud volcano, and others around the world also remind us just how very, very, mobile the subsurface can be on short timescales, for triggers that are sometimes obvious, others disarmingly subtle. Volcanic eruptions too, highlight the same thing – though the volatile content and liquid is a very differen one, the ability of liquids to move rapidly around the subsurface is more than amply demonstrated by their behaviour.
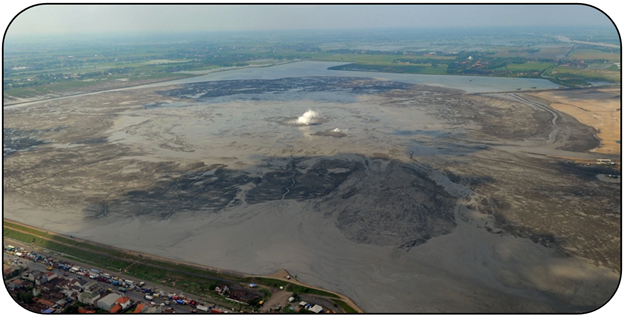
In four years the Lusi mud volcano eruption managed to shift 73 million m3 of mud (Tingay 2019), or about 460 million barrels (Figure 14). That’s bad news for anyone that thinks oil fields can’t disappear in a relative geological instant, and it’s a cautionary tale for anyone that wants to store gas underground. We often talk about geological time scales meaning very, very long ones, but in truth, geology operates on all time scales. We see the averaged result.
So…?
The subsurface is not a jerry can. It is inherently variable. Strongly so. These variations, especially in permeability, can be extreme and difficult to detect, or to model. We can do our best, but the subsurface can surprise. Sometimes pleasantly so, as at Forties Field, sometimes unpleasantly so, as at Lusi.
High permeability pathways are often more common than we suppose and their presence radically alters everything that happens in the subsurface. We have to be careful then, that when we plan contingencies, we don’t focus on the big things we can see and forget about the critical things we typically can’t. The way our fluids will preferentially go on human time scales may be very different to the geometries we image with our geophysics.
The good news is that some lithologies, like evaporites, and to a lesser extent carbonates, through either physical or chemical occluding of porosity and permeability - can provide more secure barriers. Yet even there, the interaction with faults and fractures, some discerned, others not, can provide sneaky permeability pathways to challenge the cleverest of our models. Things can be achieved, if we are careful, but we should beware the wanton assumption that is unaware it’s an assumption.
The wonders and the worries of a high permeability pathway. Sometimes geological time scales aren't so long.
Figure 14: Lusi mud volcano, Indonesia
References
- Byerlee et al 2016, Resaturated pay: A new infill target type identified through the application and continuous improvement of 4D seismic at the Forties Field, Leading Edge v. 35 p 818–924
- Grauls 1999, Overpressures: Causal Mechanisms, Conventional and Hydromechanical Approaches, Oil & Gas Science and Technology – Rev. IFP, Vol. 54 (1999), No. 6, pp. 667-678
- Law et al. 2000, The Kopervik fairway, Moray Firth, UK, Petroleum Geoscience, v. 6, p. 265 – 274
- Mallon and Swarbrick, 2008, How should permeability be measured in fine-grained lithologies? Evidence from the chalk. Geofluids 8, 35–45doi: 10.1111/j.1468-8123.2007.00203.x
- Muir-Wood & King 1993, Hydrological Signatures of Earthquake Strain, Journal of Geophysical Research v. 98, p 22,035-22,068
- Swarbrick et al. 2010, Role of the Chalk in development of deep overpressure in the Central NorthSea, Geological Society, London, Petroleum Geology Conference series, 7, 493-507, 1 January 2010, https://doi.org/10.1144/0070493
- Tingay 2019, Anatomy of the ‘Lusi’ Mud Eruption, East Java: ASEG Extended Abstracts, 2010:1, 1-6, DOI: 10.1081/22020586.2010.12042009

Dave Waters, Paetoro Consulting UK Ltd
KeyFacts Energy Industry Directory: Paetoro Consulting