With the release of the new 3D Viewer in Petrosys PRO 2021.2, users can now visualise log data along the well path.
To display log data along the wellbore, you will first need to import well and log data from your preferred 3rd party source into Petrosys PRO. Once this has been completed enable the Log Curve tab and input relevant parameters.
PRO tip – in the new 3D Viewer you can now use ‘Drag and Drop’ to display data from either Petrel or DecisionSpace using the same method as you would to bring data into Mapping.
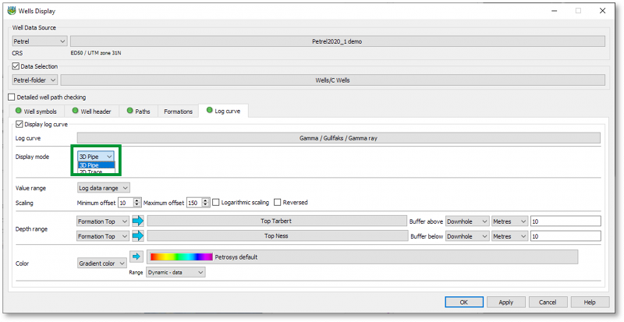
There are a couple of options available to visualise log data. Once ‘Display log curve’ has been enabled and the relevant log curve selected, you can choose between two display modes:
- 3D Pipe
- 2D Trace – for this mode, you can select either a fixed or relative azimuth
Those familiar with the display of log signature maps in Mapping will know that you can select the scale, depth range, and gradient that you want to apply.
PRO tip – note the ‘blue arrows’ can be used to quickly set the range and gradient from your interpretation source.
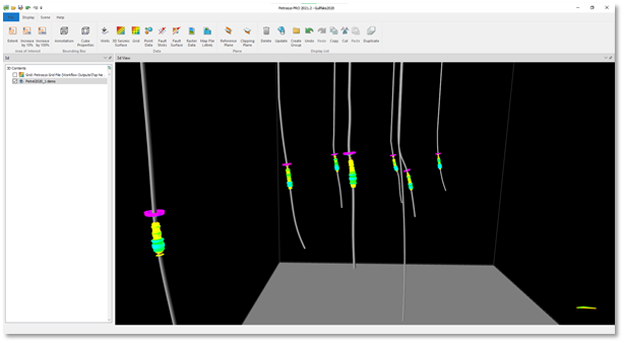
Once all the parameters have been set, you will now be able to view the log curves along the well paths in the 3D Viewer, as shown in the screenshot.
To make it easier to build visualisations in the 3D Viewer we have introduced ‘One-click Creation from Mapping‘ – this will allow you to streamline your workflows and save time by avoiding the need to rebuild the display list you have used in Mapping. With ‘One-click creation from Mapping’, all you have to do is click on the relevant icon in Mapping and the same content will be displayed across the 3D Viewer.
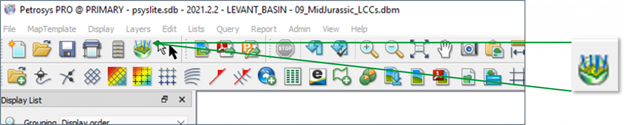
‘Start 3D viewer and load with current map content’ icon
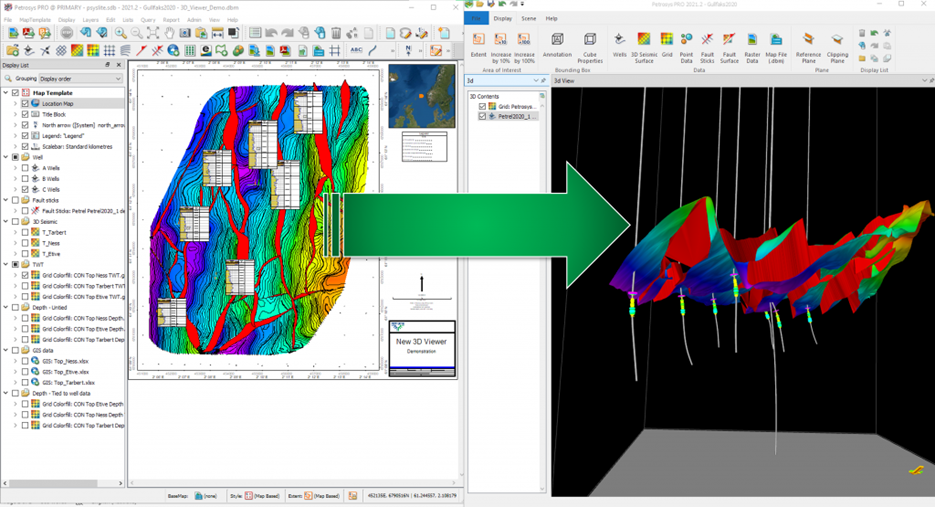
A practical example of how to use the one-click creator tool would be the following:
- In Mapping, create your map including some ‘Log signature maps’
- Click on the ‘one-click’
- See how a new 3D Viewer with the same content of the map is created.
KeyFacts Energy Industry Directory: Petrosys