Kevin Ward
Vice President: Europe and Africa at Petrosys
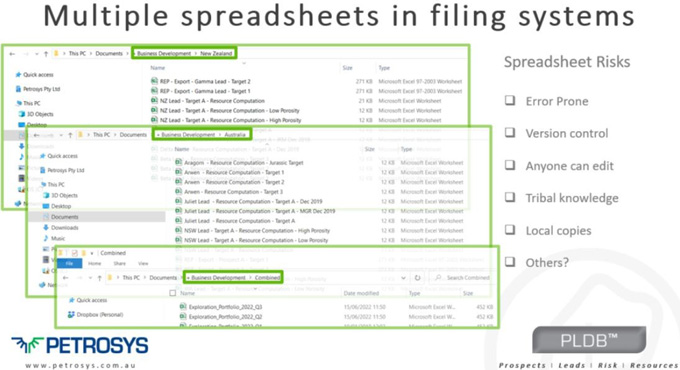
Recently, I have run several presentations which describe the challenges of managing E&P portfolios in spreadsheets. During the presentation, the slide that typically generates a bit of debate is the one below, titled ‘Multiple spreadsheets in filing systems’ and showing the associated risks involved with this.
The old adage ‘if it ain’t broke’…
With time and budget focused on improving things elsewhere the reliance on spreadsheets is an issue that resonates with many and the ‘good enough’ approach is often felt to be sufficient. But with fewer exploration wells now being approved for drilling and with success rates so low, perhaps managing E&P portfolios in spreadsheets is an outdated method of evaluating portfolios that is indeed broken.
If our end goal is to increase success rates, provide a return on investment to shareholders and deliver energy to those who are increasingly desperate for it, should we not be looking to improve the quality of the data used to support the difficult decisions management need to make?
Let’s take a step back. How do we arrive at having all this prospect data in spreadsheets? Where did our data come from?
There are many software tools in the industry to perform prospective resource calculations including, GeoX, REP, ROSE, and of course Petrosys PRO, where the calculations are done inside an industry leading geoscience mapping toolbox. All these applications do this by allowing the geoscientist to vary the expected or calculated ranges of various parameters, and then by applying stochastic calculations, derive a range of possible outcomes for the potential prospective resources. Often best expressed in the P10, P50, and P90 volumes. There are also some newer players on the market like Seisquare who automate this process, whilst making use of all the data available to quantify the uncertainty.
However, we then need to evaluate these figures, make decisions, and report them back to management. This may be for regular portfolio reviews (e.g. what size is my portfolio to present to the Board?) or it may be for budgeting next year’s 2 or 3 exploration wells.
In many cases it is at this point regardless of what high end sophisticated software the original calculations have been exported from, the data ultimately ends up contained in an Excel file. These Excel files are then concatenated into an overall portfolio spreadsheet, and this is managed by 1 person (or a small group of people) in the portfolio management team who shares it with management.
Spreadsheets are great…but…
The Excel files are usually very complex and make no mistake, often very impressive, but are held together by convoluted and bespoke workflows that only 1 or 2 people in the company know how to run or edit.
It’s no secret that spreadsheets are risky and contain far more errors than we realise. At the recent SPDM online conference, Jess Kozman showed a few examples of this, including my favorite which was when JP Morgan Chase lost $6 Billion because of a copy and paste error in their risk spreadsheets!
Similarly one of Petrosys’ sister companies working in the Environmental Software space has published an article tackling the pitfalls of putting our trust in spreadsheets, ‘Sometimes Saving a Dollar Can Cost You A Billion‘
Looking at all this research I came up with the Spreadsheet Risk List.
Error-prone
88% of all spreadsheets contain errors (Panko, 2005). By the sheer complexity of prospect calculations, we can’t assume this would be any different, possibly even higher as each prospect has to be transposed from 1 output spreadsheet into another spreadsheet. As a geoscientist, how confident are you that the figures you are presenting to the exploration manager or board are accurate enough?
Version control
But even if you are confident of accuracy – how sure are you that they are the latest figures? The prospective resources of each prospect change regularly as G&G teams update interpretations. Knowing how the resource calculations are changing through time is a strategic advantage – not knowing if you’re looking at the most recent spreadsheet figures, is a huge risk!
Anyone can edit
Across the multiple Excel files in use, there is the potential for anyone to edit some of the figures – even with the best of intentions. It wouldn’t be immediately clear who, what or why these changes were made, and has the potential to be costly. The ability to track these changes through time, control who can make the changes, record when and why they made the changes, and be able to revert to any previous calculations should we decide that is the appropriate action to take, would be useful here.
Tribal knowledge
We’ve already established that the overall spreadsheet to capture the portfolio is often very impressive! It has usually been created and maintained by someone senior in the organisation who has been involved in this process in the industry for decades. The disadvantages, however, are that it is usually only this person who knows how to fix things when they go wrong, or when a report of the summary figures is due, and it is likely this person is approaching retirement age (sound familiar?).
Migrating these spreadsheets into a system that is used at many E&P companies and is flexible enough to bring in the bespoke calculations and nuances created by senior portfolio specialists for their companies over many years. It would be wise to make such a switch to a robust and flexible system now, whilst these specialists are still in the industry, such that we can capture their expertise during that process.
Local copies
Prior to Covid, this was still an issue as people were working from different offices. Now that many people will be working remotely for a large part of their week, it’s even more imperative that we don’t create our own local versions of files to work on, even if it’s just for a few hours or a few days. When the Board needs those summary figures, they need to be easily accessible on demand and trusted to be the most up to date and latest version for all prospects in all regions.
KeyFacts Energy Industry Directory: Petrosys