The North Sea Transition Authority are the UK’s oil, gas and carbon storage regulator, tasked with driving the energy transition in the North Sea.
Embedding digitalisation and making data open and available is one initiative to drive this. As part of this, the Energy Act 2016 requires each UKCS operator to appoint a named Information and Samples Coordinator (ISC), who is responsible for reporting petroleum-related information to NSTA. Section 34 of this act requires pipeline and infrastructure data to be reported. Essentially, this is ‘the kit’ which sits on the seabed, undersea and at surface – be it pipelines, cables, SSIVs, platforms.
Knowing what infrastructure is present, where, what it is called, who owns it and its operational status creates a system of record for the NSTA, North Sea operators and other interested parties. Since late 2021, the data – previously provided in tabular format – now has to be submitted in a spatial format.
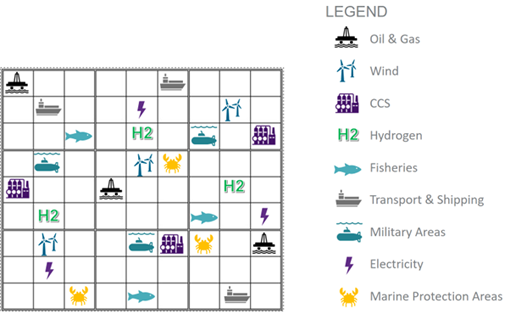
Adding the ‘where’ piece greatly improves the database’s completeness and usefulness, with applications for fishing safety at sea (see FishSAFE, and this example from California), decommissioning, repurposing and reuse. This also helps to manage competing interests in the North Sea – what one of our GIS Strategy consultants dubbed ‘seabed sudoku’ (see example).
We’ve been helping customers collate and submit this data to NSTA since ‘spatial’ became a requirement, and recently presented alongside NSTA and others at the Esri Energy Resource conference in Nov 2022.
The NSTA provide plenty of documentation, but sometimes the process can be tricky because of the difficulty in collaborating across several teams to identify the internal source of ‘truth’ of data, the volume of data to be processed, and the QC checks the data must pass at submission.
We won’t repeat the suggested workflow steps here, but to any ISCs out there apprehensive about the next reporting cycle, here are a few pointers that may help.
What do you need to submit?
So, what needs to be submitted? At the last reporting cycle (May 2022), the offshore infrastructure data consisted of six datasets:
- Surface points – platforms, FPSOs, etc.
- Subsea points – wellheads, manifolds, etc.
- Pipeline points – spools, valves, etc.
- Linear subsea features – anchor cables, seismic cables, etc
- Linear pipelines features – pipelines, umbilicals.
- Freespans.
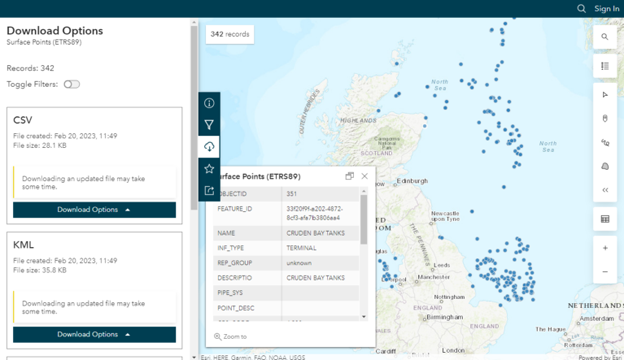
The existing datasets are on the NSTA Open Data Centre. You can download the data in a variety of formats (shapefile, KML, GeoJSON). Note that the data are available in one of three geographic coordinate systems: using either WGS84, ED50 or ETRS89 datums.
Though the dataset schemas may change at the next reporting cycle, the above gives you a good idea of the information that will need to be provided – i.e. a series of datasets containing your company’s infrastructure information, indicating changes that have occurred since last reported. The data can be submitted back to NSTA in shapefile or File Geodatabase format.
Selecting a subset of your company’s records/features from these datasets is a good starting point. Using the out-the-box editing tools in ArcGIS Pro you can add new or edit existing features, including changing both their attribution and geometry.
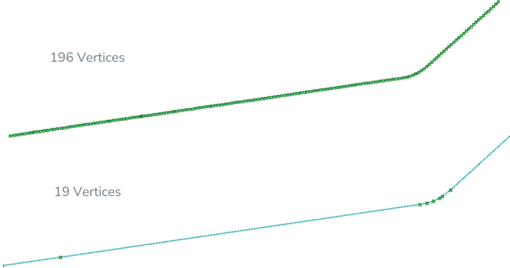
ArcGIS tools allow you to import data from CAD, if that’s where your infrastructure data is mastered, or import data from Excel or other tables. Data imported from CAD may then require further cleaning or update – e.g. joining what should be continuous lines, or simplifying the numbers of vertices in line datasets. This can then be merged into your copy of the relevant dataset, and attributed as required.
Once submitted, NSTA run a series of processes to automatically QC the data. The reviewed, finalised data is compiled into the publicly available ‘live’ datasets.
How can you make the submission process smoother?
Whilst manually editing the data is frequently necessary to get the updates in place, automating as much of the process as possible is important. The ArcPy module of ArcGIS can be used to automate data loading tasks using Python scripts, such as updating attributes to match domains or replacing an existing feature’s geometry with the updated, correct geometry, whilst maintaining the attribution.
Similarly, Tasks in ArcGIS Pro can provide a preconfigured workflow to step through, such as running quality checks on data before submission. Even simple tools like the Data Engineering function in ArcGIS Pro can help to quickly summarise data attributes and identify gaps in mandatory attributes.

Data Engineering tool in ArcGIS Pro to review attributes presence
We recommend making full use of the submission windows to work with your colleagues to pull the data together and ensure it is QC’d, and use any trial window provided by the NSTA to upload test versions of the data to check against requirements. Collaborating with partners to ensure clarity on who’s responsible for reporting what may also be necessary.
How to manage updates on ongoing basis?
The data you’ll be working with for each reporting cycle will very much depend on the data quality prior to that. Clearly, managing the data well on an ongoing basis will reduce effort required during any given reporting period and make submission smoother.
Data governance matters – decide who owns the data, who’s responsible for update and QC, where it is mastered (GIS, CAD) and what the standards are around it (e.g. using an IOGP data model, such as SSDM, OISDM or another data model). Using a well-established process to make few changes more often will likely be easier to manage than irregular, larger updates. Such an approach will also align with any change by NSTA from six-monthly cycles to more frequent, ongoing reporting.
Whether or not you’ve got dedicated GIS resources to help, managing the data as efficiently as possible is clearly preferable. As well as the tips we’ve provided above to help automate and streamline processes, using mapping apps in ArcGIS Enterprise or ArcGIS Online can make the data more accessible to the engineers and subsea specialists to visualise and, with editable layers and tools, to flag changes quickly and easily, check changes to data, or even make edits directly.
Where to go next?
Once the data is well managed, and the reporting more seamless, other opportunities will present themselves to gain value from the data, and it will be easier to incorporate related data. This might include linking the spatial data to survey reports, images or other documents in SharePoint, or to ROV video from inspection and other surveys; looking for patterns in data over time, such as changes in freespans or seabed movement; visualising data in 3D alongside MBES and other survey data; and incorporating real-time data, like vessel tracks, to manage ongoing operations.
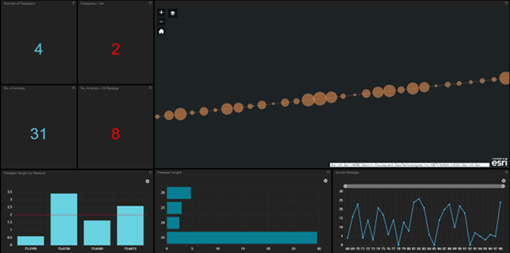
ArcGIS Dashboard showing freespan data for given section of pipeline (dummy data)
Ian Peebles, Head of GIS Services, Getech
KeyFacts Energy Industry Directory: GETECH