SEISMIC MODELLING
Rock physics has its origins in the 1980s with the evolution of seismic processing flows able to retain true, geologically meaningful amplitudes. Since that time, rock physics modelling (when correctly applied) has been used to de-risk amplitude driven hydrocarbon prospects around the world. Many workers are now bringing rock physics methods to CCS challenges, but what questions can it answer and what limitations do we need to be aware of?
In the CCS domain, there are three main workflows where rock physics can add value:
- Rock Characterisation.
- Working with 4D Seismic and Inversion.
- Seismic Modelling, specifically fluid substitution modelling.
SEISMIC MODELLING
Seismic models can be used to understand the expected seismic amplitude response to changes in reservoir conditions. For CCS, a key question would be “do seismic amplitudes change by a discernible amount due to CO2 injection?”. To answer this, models are created to observe the sensitivity of elastic properties (and hence seismic amplitudes) to changes in CO2 saturation and/or pressure. If this feasibility modelling suggests seismic amplitudes are not sensitive to the changes induced by CO2 injection, then acquiring repeat seismic is not going to be helpful for CO2 monitoring and alternative technologies must be sought. Indeed, a CCS project could fail at the screening stage if 4D seismic is shown to be ineffective for plume monitoring and no other technologies can be identified which provide sufficient risk mitigation.
GASSMANN’S FLUID SUBSTITUTION MODELLING
Fluid Substitution Modelling allows rock physicists to model the effect of removing the saturating fluid (let’s assume this is brine) and replacing it with something else (e.g. a mixture of CO2 and brine). Figure 1 below summarises the Gassmann Fluid Substitution workflow and the data required.
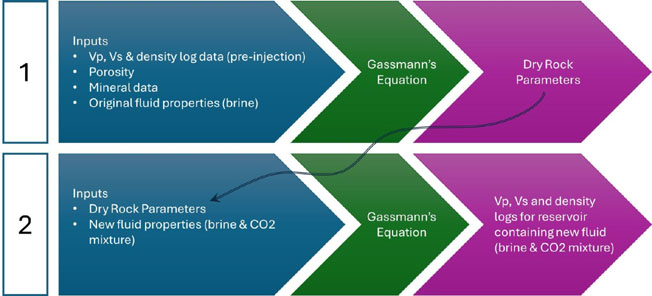
Figure 1. The two steps of Gassmann’s Fluid Substitution Modelling
In this example, the final outputs of Gassmann Fluid Substitution Modelling would be a set of Vp, Vs and density logs representing the reservoir when filled with a mixture of CO2 and brine, with saturations specified by the user. The amplitude effect of this new fluid scenario can be visualised by convolving the modelled logs with a representative seismic wavelet to generate a synthetic trace. Finally, the top reservoir amplitude under pre-injection conditions can be compared to the modelled amplitude for the CO2 scenario, allowing the amplitude change to be quantified.
The Essentials of Rock Physics course (now available through Merlin) dedicates a whole day to Gassmann’s Fluid Substitution, but for this article I will just focus on how fluids are parametrised and how the workflows for CO2 differ from hydrocarbons.
DRY ROCK PROPERTIES
Returning to Figure 1, the output of the first step of Gassmann’s modelling is a set of dry rock elastic parameters. These are a useful QC tool to make sure Gassmann is behaving itself, but the dry rock bulk moduli are also helpful for indicating the amplitude sensitivity of a reservoir to changes in fluid composition. If the rock frame is very stiff and incompressible (blue carbonate points in Figure 2 below), it will dominate the elastic properties of the bulk rock i.e. the fluids won’t get a look-in, no matter what their composition. Conversely, if the rock frame is soft (yellow Smeaheia sandstone points in Figure 2), it will allow the properties of the pore saturating fluids to exert much more of an impact on the bulk rock properties. The latter scenario affords the opportunity of using elastic properties (and hence seismic amplitudes) to distinguish between different pore fluid types e.g. pure brine vs a CO2-brine mixture.
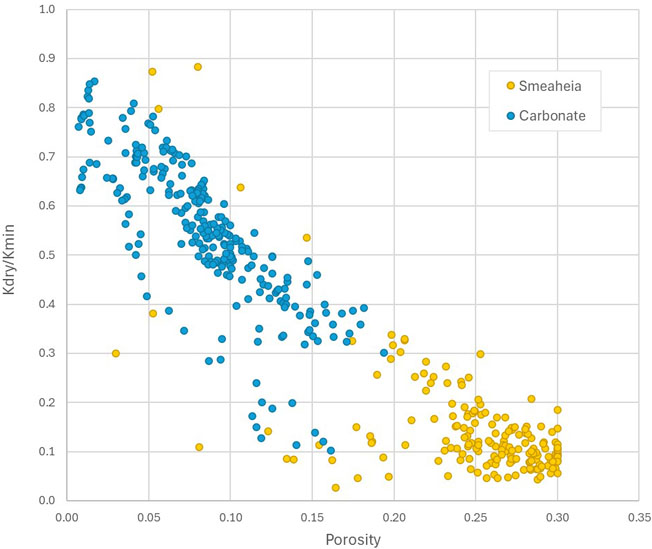
Figure 2. Kdry/Kmin (telling us about the rock frame stiffness) vs porosity for the sandstone storage unit at Smeaheia compared to a carbonate reservoir. Smeaheia data from the CO2 Storage Data Consortium, Smeaheia Dataset. Data Owners: Equinor ASA and Gassnova SF.
The key take away from this is that not every rock frame is susceptible to revealing changes in CO2 saturation via amplitude analysis. Fortunately, this is something a rock physicist can screen for before the decision to invest in 4D seismic is made. If the rock frame is too stiff to allow CO2 monitoring through 4D seismic, an alternative monitoring strategy must be sought.
Elastic Properties of Fluids
The elastic properties of fluids must be calculated for the in-situ conditions as well as for the new fluid mixture being modelled. When working with hydrocarbons, the elastic properties would normally be calculated from the Batzle & Wang equations (1992), however, these are inadequate for modelling CO2 as they do not describe temperature and pressure in sufficient detail. For calculating the elastic properties of CO2, the Span-Wagner (1992) equations of state are considered the gold standard. Figure 3 shows Vp calculated using Batzle-Wang compared to Span-Wagner – the difference is alarming!
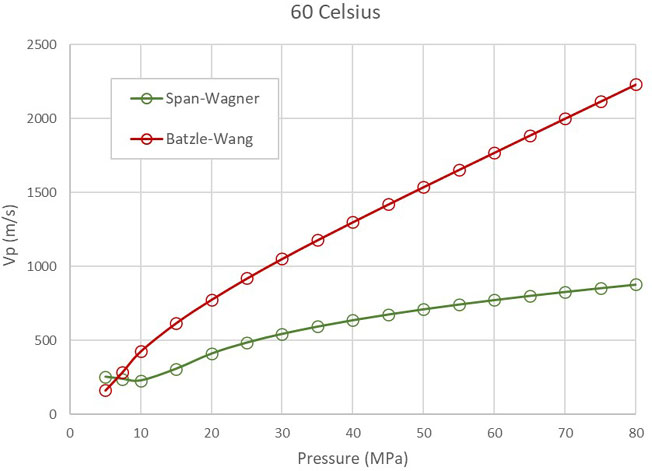
Figure 3. P-Wave Velocity vs Pressure for a constant temperature of 60 °C. Note the alarming difference in calculated Vp between the two methods.
MIXING CO2 AND BRINE
How the CO2 is distributed within the brine can have a significant impact upon seismic amplitudes, Figure 4. It is therefore critical to have an understanding of how the fluids are mixed when creating models to calibrate the 4D amplitude response, or at least an appreciation of this sensitivity.
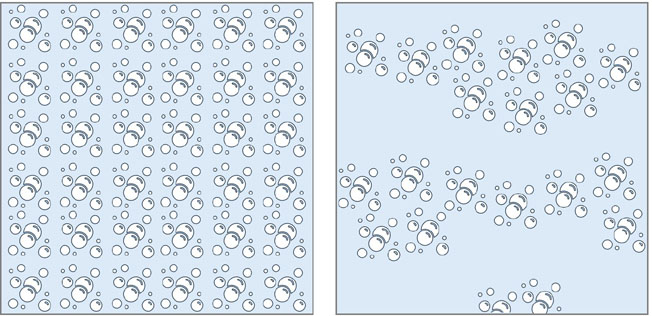
Figure 4. Homogeneous (L) vs Patchy (R) saturation of CO2.
When CO2 and brine are mixed homogeneously, there is a dramatic amplitude change when the first increments of CO2 are added to the mixture (Figure 5a). The amplitude response to further increases in CO2 saturation is then much more subtle. This is the “fizz gas” effect which is infamous for hampering our ability to seismically distinguish between residual and economic hydrocarbon gas accumulations. However, if the CO2 and brine have a more patchy distribution, the relationship between amplitude and CO2 saturation becomes much more linear (Figure 5b). In this scenario, the possibility of using seismic amplitudes to infer CO2 saturation becomes much more straightforward.
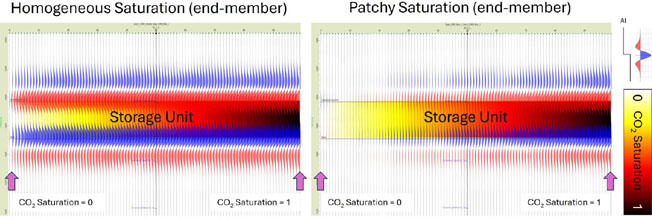
Figure 5. Synthetic trace modelling showing the impact of varying CO2 saturation (a) for a homogenous mixture of CO2 and brine and (b) a patchy mixture of CO2 and brine (Brie exponent=1). The coloured central panel represents a storage unit with CO2 saturation increasing from left to right. This modelling was carried out using Ikon’s RokDocTM software and the Smeaheia dataset available from the CO2 Storage Data Consortium. Data Owners: Equinor ASA and Gassnova SF.
CONCLUSIONS
Rock physics modelling should be used to assess the expected amplitude response to adding CO2 to in situ reservoir fluids. If the magnitude of the amplitude change is sufficient, then 4D seismic will be a good option for monitoring the progress of the CO2 plume. Fluid substitution models can then be used to calibrate observed 4D amplitude responses to CO2 saturation and/or pressure changes. If the magnitude of the amplitude change is too weak to be seen on seismic, then acquiring 4D seismic will not be worthwhile and an alternative monitoring strategy will be necessary. Indeed, the CCS project may fail the screening stage if a sufficiently confident strategy for monitoring containment and conformance cannot be found.
The standard fluid substitution workflow for hydrocarbons must be updated when applied to CO2 injection. It is crucial that appropriate models for CO2 are used to carry out fluid substitution to ensure that predicted amplitudes are consistent with the real-world amplitude response. Investment decisions made on bad modelling could prove costly and, in the worst case, dangerous, so it’s well worth spending the time to get the rock physics right!

Eleanor Oldham, Senior Geophysicist at Merlin Energy Resources
KeyFacts Energy Industry Directory: Merlin Energy Resources