By David Bamford. Director at Future Energy Publishing
I hope you will all forgive a 3rd article that draws on a report by the IEA, in this case their 2025 Global Methane Tracker (Global Methane Tracker 2025 – Analysis – IEA):
From this overview of global methane emissions, I will argue in the rest of this article, there are 4 takeaways:
- Viewed ‘post-Covid’, global methane emissions are rising not falling.
- ‘Informal police forces’ that scour satellite data for methane plumes seem to be having no impact. Indeed, their resort to public forums may be counterproductive.
- The Oil & Gas industry is subject to many regulations but there is only ‘light touch’, if any, enforcement. Waste and Agriculture are weakly regulated. In every sector there is little in the way of actual measurement, lots of assertions.
- Investors – in fact, all stakeholders – need to figure out how to hold companies to account. They have not yet done this.
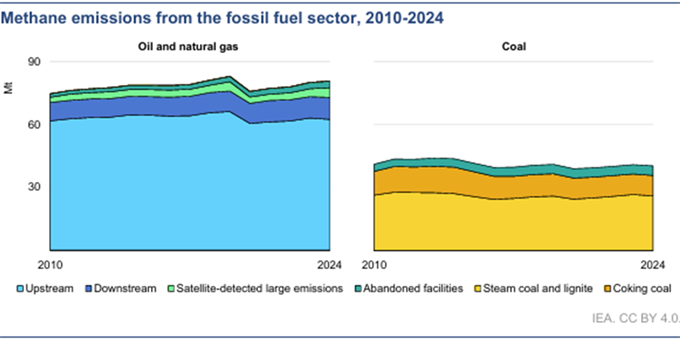
Methane emissions from the fossil fuel sector, 2010 - 2024
Why aren’t global methane emissions falling?
Actually, and firstly, according to Climate Trace(1), global annual volumes have risen slightly since 2021:
2021: 384.39Mt
2022: 389.64Mt
2023: 390.74Mt
2024: 391.79Mt.
These are for all sectors - Oil, Gas & Coal; Power generation; Manufacturing; Agriculture; Transportation; Waste; but not Wetlands - and are based on a unique Climate Trace ‘approach’(1).
Secondly, as shown in the above graphic, the IEA reports(2) that methane emissions from Oil, Gas & Coal have been essentially flatlining at 120Mt per annum since 2019 - note that Carbon Trace reports ~158Mt, also more or less flatlining.
I think two questions then arise:
- Given the focus on ‘fossil fuel’ methane emissions - at COPs; by well-marketed new satellite capabilities such as MethaneSat, Carbon Mapper, the IMEO; by the UN, EDF, IEA; and support from august media such as the BBC, Bloomberg and the Grauniad - why have the global numbers not merely gone down but not plummeted?
- If the rise is real, not just a statistical artifact, what is the reason?
With respect to the first question, a recent article(3) Bloomberg maybe offers an answer; here’s what I see as a couple of key paragraphs:
“Caltagirone heads the International Methane Emissions Observatory, or IMEO, an informal police force that's the tip of the spear in the global war against the potent greenhouse gas. His team at the United Nations includes researchers who scour satellite data to identify and sound the alarm on methane plumes in an effort to help nearly 160 countries that are backing a pledge made almost three years ago to cut pollution 30% by 2030.
Since it launched a notification system in 2022, IMEO has told companies and governments about more than 1,100 giant methane clouds escaping from oil and gas facilities. Yet the number of releases that it’s verified have been halted “can be counted on two hands, maybe one,” Caltagirone said. “Action taken in response to the notifications is lower than we were expecting.””
With respect to the second question, I stumbled across this paper(4) a few weeks ago entitled “Rapid shift in methane carbon isotopes suggests microbial emissions drove record high atmospheric methane growth in 2020–2022” the abstract of which reads:
“The growth rate of the atmospheric abundance of methane (CH4) reached a record high of 15.4 ppb yr−1 between 2020 and 2022, but the mechanisms driving the accelerated CH4growth have so far been unclear. In this work, we use measurements of the 13C:12C ratio of CH4 (expressed as δ13CCH4) from NOAA’s Global Greenhouse Gas Reference Network and a box model to investigate potential drivers for the rapid CH4 growth. These measurements show that the record-high CH4 growth in 2020–2022 was accompanied by a sharp decline in δ13CCH4, indicating that the increase in CH4 abundance was mainly driven by increased emissions from microbial sources such as wetlands, waste, and agriculture. We use our box model to reject increasing fossil fuel emissions or decreasing hydroxyl radical sink as the dominant driver for increasing global methane abundance.”
I confess I had to Google on what the ‘hydroxyl radical sink’ is but I understood ‘increased emissions from microbial sources such as wetlands, waste and agriculture’ without doing that!
Back to Climate Trace, their combined global emissions numbers for Agriculture and Waste are:
2021: 216.96Mt
2022: 217.85Mt
2023: 218.29Mt
2024: 219.29Mt.
ie drifting up slowly, again despite all the attention from ‘informal police forces’.
This is just my humble opinion of course but if I’m an ‘Installation Manager’ in charge of an oil & gas facility, a coal mine or, for that matter, a farm, landfill, or anaerobic digester, why would I engage with an ‘informal police force’ who are going to rush off to talk to media, regulators or government, attended conferences in far-off places, rather than privately sitting down face-to-face with me or my facility/company owners?
I’m completely unsurprised that the response doesn’t meet expectations. My stance would be that I do, and report, only what the Regulators currently ask for which is often light touch and weakly enforced. I’d be content to “Mark my own Homework”!
I’m with Mr Donegan(5) on this!
By the way, there was an 1998 estimate(6) that global annual methane emissions from Wetlands were ~145Tg (145Mt to mere mortals) but this number included an estimate of ~53Tg from Rice Paddies which are categorised by Climate Trace as Agriculture. Browsing more recent estimates, 153, 162 and 194Tg per year are all stated with authority…….
1. https://climatetrace.org/explore/#admin=&gas=ch4&year=2024&timeframe=100§or=&asset= https://climatetrace.org/approach
2. https://www.iea.org/reports/global-methane-tracker-2025
3. https://www.bloomberg.com/news/features/2024-11-04/cop29-methane-pledges-aren-t-yet-reducing-emissions?cmpid=BBD110424_GREENDAILY&utm_medium=email&utm_source=newsletter&utm_term=241104&utm_campaign=greendaily
4. https://www.pnas.org/doi/10.1073/pnas.2411212121
5. https://www.linkedin.com/posts/sean-donegan-2249971_methanemeasurement-methaneemissions-activity-7263291046149709826-z1-r/?utm_source=share&utm_medium=member_ios
6. https://www.sciencedirect.com/science/article/abs/pii/S1352231098001058
KeyFacts Energy Industry Directory: Future Energy Partners l KeyFacts Energy: Commentary