
Dave Waters, Director/Geoscience Consultant, Paetoro Consulting UK Ltd. Subsurface resource risk, estimation & planning
Introduction to this analysis
There is a lot of commentary on global oil and gas use that treats demand almost as some fixed inexorable thing. This is often not done deliberately, but almost subconsciously – out of habit. That sense that we are all just passive players at the mercy of global trends in demand and that is our lot, come what may.
Also, we see a lot of attention paid to overall global trends, and less individual attention to the trends of regions. The world is such that often one region can dominate the overall picture. That is one element of reality that we need to consider. However if we do only that, we may neglect to observe historical evolutions within other individual regions that might hold information for what is going to happen next - in regions that for now are behaving quite differently.
There is no guarantee of that, but it is worth looking.
On top of these tendencies, we often see a lot of focus on demand trends without looking at production trends. It is important to look at both together, especially for something like oil and gas, because the production is not without constraints. The demand trends of the past are no indication of the future if the world or its individual regions are starting to hit ceilings on production.
Those ceilings are not always primarily driven by availability of resource, although it is a factor. They are more typically driven by the cost of extraction. There will typically be more resource to obtain in any given region – what changes is the cost competitiveness of extracting it relative to other oil and gas producing regions, and relative to costs of alternatives to oil and gas. What we can also suspect is that different regions will attach different value to the resource in their own regions. Some might be prepared to pay more for it than others – for a variety of political, strategic, and various resource availability reasons.
What follows then is a relatively simple look at oil and gas demand and oil and gas production for the globe, broken into seven regions. Let’s digest what it says. The aim of this analysis is really to challenge the assumption that we are at the mercy of oil and gas demand trends, and to highlight how we can be much more proactive players in influencing those trends.
Data sourcing & grouping
This analysis has been a very quick look, relying on the data compilation of Our World in Data (ourworldindata.org, Ritchie et al., 2025b, 2025c, 2025a, 2025d) which is itself, to use Our World in Data’s phrasing, “a major processing” of data from the Energy Institute’s Statistical Review of World Energy (Energy Institute (EI), 2025). Now undoubtedly there may be all sort of nuances to examine in how data is compiled and processed by these organisations, but for the purposes of this quicklook we are going to assume the analysis is sufficient to discern regional trends over the periods considered. The analysis by Our World in Data groups the world into seven different regions, which I believe constitute:
- Africa
- Asia-Pacific (excluding CIS & Middle Eastern nations)
- CIS. In 2025 the “Commonwealth of Independent States” – was selected former Soviet Union nations of Armenia, Azerbaijan, Belarus, Kazakhstan, Kyrgyzstan, Russia, Tajikistan, Turkmenistan, and Uzbekistan. My understanding is that Moldova, Azerbaijan, and Armenia are included in CIS in Our World in Data’s analysis along with Georgia and Ukraine. This is despite these nations being in Europe and despite Ukraine and Georgia leaving the CIS following conflicts with Russia. Turkmenistan is also only an associate member.
- Europe (excluding CIS nations & Turkey)
- Middle East (including Turkey)
- North America (USA, Canada, Mexico)
- South and Central America (not Mexico)
For any disagreeing with these groupings, I empathise, but I’m working with what is given.
In terms of my own data processing, when looking at oil demand charts by region, what we often tend to see is a cumulative pile of results, as per Figure 1. This tends to focus visually on the overall global trend. What I like to do, and have done, is download the data and chart it instead in a non-cumulative fashion, the data for each individual region. This has the advantage of allowing greater discernment of the trends taking place in each region, visually unimpaired by those of other regions.
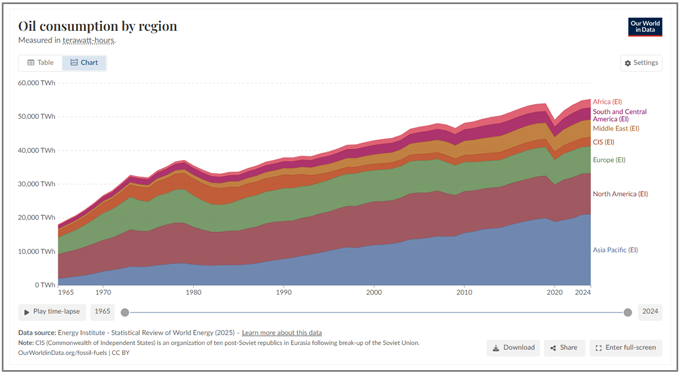
Figure 1
TWh conversions
To mine individual countries, I also refer to CEIC data presentations ( www.ceicdata.com ) which quote figures in kboe/d.
Although it depends on individual oil qualities, one million barrels of oil equivalent (boe) or 1000 kboe (1Mboe) is about 1.6282 TWh. One TWh is equivalent to 3.6 Petajoules. (1 PJ = 1015 joules).
1000 kboe/day or 1Mboe/d is then ~ 365250 kboe/year, 365.25 Mboe/year or about 594.7 ~ 600 TWh/year. Or put another way, to go roughly from kboe/d to TWh/year, multiply by 0.6.
Note also that converting from oil and gas volume used per day also involves a reverse efficiency assumption to convert to primary energy in TWh, and that these efficiencies are time variant. Oil and gas efficiencies relative to electrical primary energy provision are typically assumed to be about 36% from 1965 to 2000, and then increasing gradually by increments of 0.2% to 0.3% per year between 1965 and 2000, reaching 40.5% by 2020 (BP, 2022).
For an example, say of Indonesia (Figure 3) we can see using rough conversion figures that 1633.197 kboe/d or 1.633 Mboe/d is about 960 TWh/year. That it is actually given by Our World in Data as ~ 879 TWh for that year is an indication of how these things can vary a bit depending on oil qualities, and the time variance of consumption and efficiency.
1 boe is typically around 6 mmscf when converting for gas (1 Tcf ~ 170 Mbbl).
Oil Consumption
The oil consumption per region is shown in Figure 2 and what is immediately apparent is that any global increase in global oil demand is totally dominated by the Asia-Pacific region. What is perhaps less obvious from the data when we pile it on top of each other as per Figure 1 is that many regions saw their peaks long ago. For Europe it was 1979, and for North America it was 2005. For CIS nations it was 1981, although arguably some of ensuing decrease to 1999 can be attributed to upheavals and economic uncertainties in the former Soviet Union, with slow levels of growth in consumption since then, still only to about half of a 1981 peak. For Central and South America the consumption peak occurred in 2014 and has declined since then.
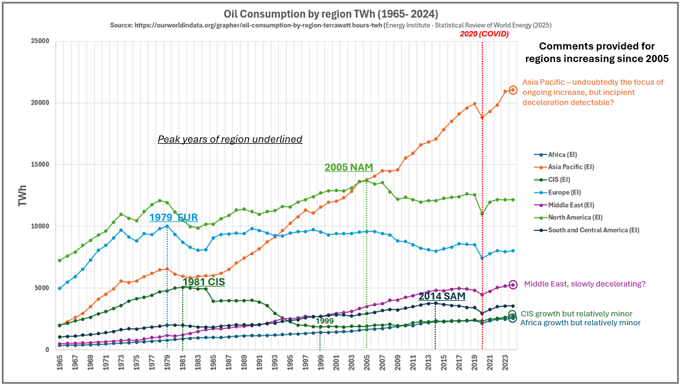
Figure 2
Understanding the details of why things have happened as they have in each region is of course an involved topic, and each country is different. Clearly though, the Asian “tiger” story is an interesting one. The COVID pandemic affected virtually every country globally, but we can see in Figure 3 for Indonesia, all sorts of ups and downs can occur for various domestic reasons. These can include subsidy changes in producing countries, but for Asia, rapidly growing countries like Vietnam (Figure 3) are perhaps more representative of recent trends.
For some of the more maturing and low population increase, developed economies in Asia, like Japan, we see a very different trend of steadily declining consumption (Figure 4). For the country everyone looks to right now, China, we see a history of long almost uninterrupted steady increase, even COVID barely held it back (Figure 4). Interestingly though, 2024 sees a decrease. Clearly seeing the undulations we see in lots of other countries, a one year deflection is not really enough to read too much into, however who can fail to note that virtually nothing else since 1965 caused an annual decrease in China, yet 2024 saw one. It’s hard to resist temptation to infer onset of something different.
It is often the “modus operandi” by many to infer all Asian economies will continue steady almost exponential growth in oil consumption, yet if we look at two more south Asian countries – India and Pakistan (Figure 5) we see further evidence (if Japan and China were not enough) that the real story is far more nuanced. India might at first glance reinforce the view, but after a COVID dip the annual increase since seems to be decelerating. Early days to see how sustained that trend is, but meanwhile in Pakistan, the trend is quite different, with notable change since around 2000. A bouncy road since then, but on the whole since 2015 an overall trend of decrease.
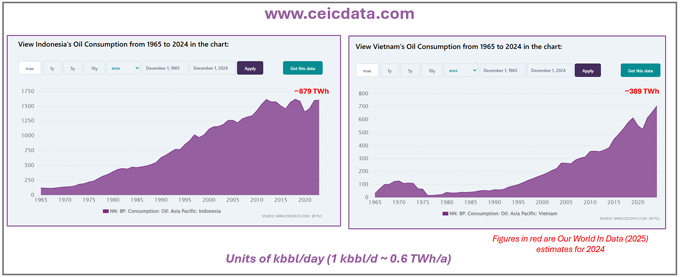
Figure 3
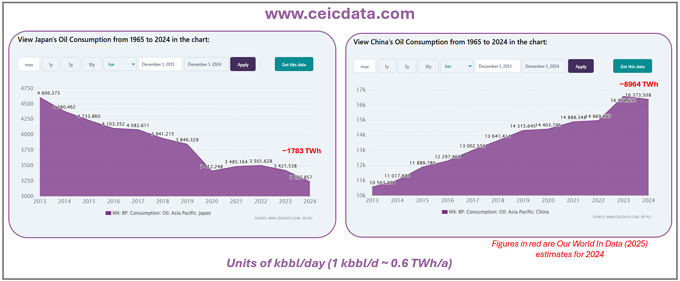
Figure 4
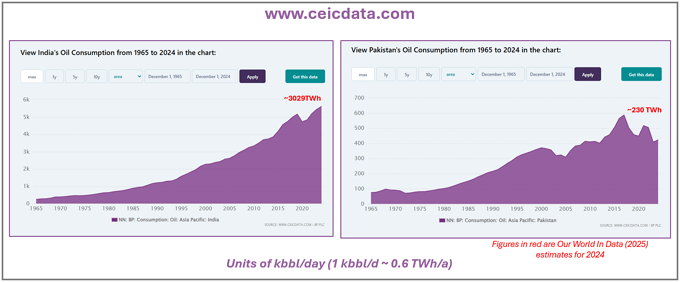
Figure 5
The overall behaviour of Central and South America, including Mexico, is also a little bit counter intuitive, noting the decline since 2014. Perhaps this is due to economic uncertainties of various characters in many of its big players. Like other countries we have seen, Brazil has been somewhat undulatory ever since ~2013, and Argentina has been going up and down quite dramatically, but in general again decreasing since ~2013 (Figure 6). A trend repeated even more dramatically in Venezuela for obvious political reasons (Figure 7). Although a bit less dramatic, the story is also true of Mexico since about 2007/2008 (Figure 7).
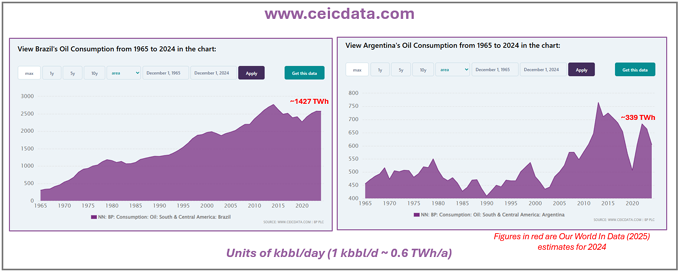
Figure 6
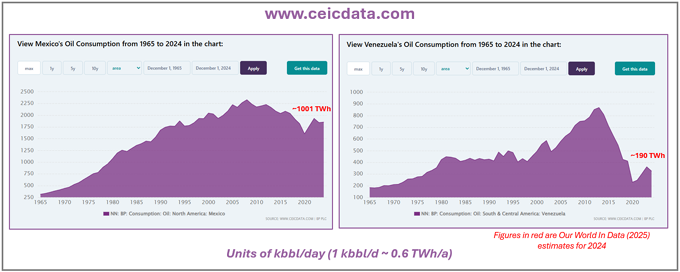
Figure 7
The CIS/Russia story is a bit easier to understand with a dramatic political upheaval cliff occurring in the years 1989 to 1994 and recovery being relatively gradual, only to about 50% or less of 1989 peaks, as illustrated by Russia and Uzbekistan in Figure 8.
Even in Africa, the continent often espoused as a demand explosion lurking, shows a very nuanced story in detail. South Africa like other countries looked at so far, shows an inflection from 2015 and general decrease since (Figure 9). Algeria, a strong producer, also shows an inflection at around 2015, but though undulatory the trend has been of slower growth since then, relative to the period before (Figure 9).
Even in a giant producer and rapidly growing Middle Eastern nation like Saudi Arabia, we again see the consumption undergoing a significant inflection around 2015, and “hovering” in undulatory manner since (Figure 10). In another regional Middle Eastern giant producer, Iran, the plateau kicked in earlier around 2005 – for various political and economic reasons (Figure 10).
In two big regional power countries that straddle regions – Egypt straddling the Middle East and Africa, and Turkey straddling Europe, the Middle East, and CIS, we see not dissimilar trends (Figure 11). 2015 bring an inflection point to Egypt with hovering and net decrease since, while Turkey has remained more bullish, with an inflection around 2015, but net gradual increase since.
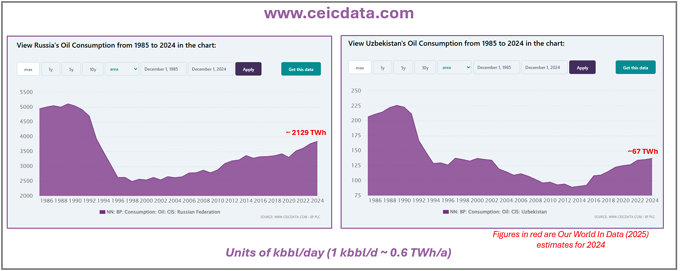
Figure 8
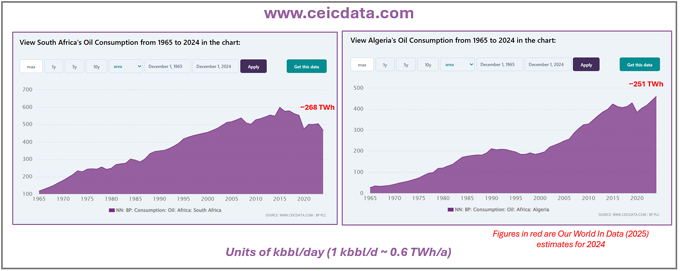
Figure 9
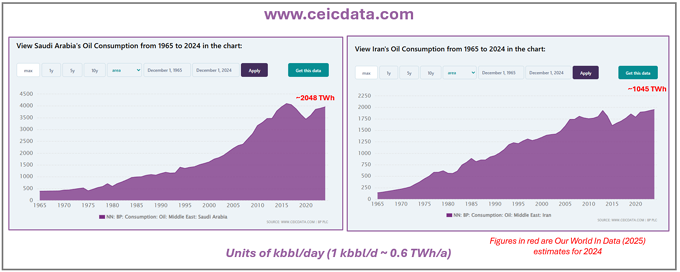
Figure 10
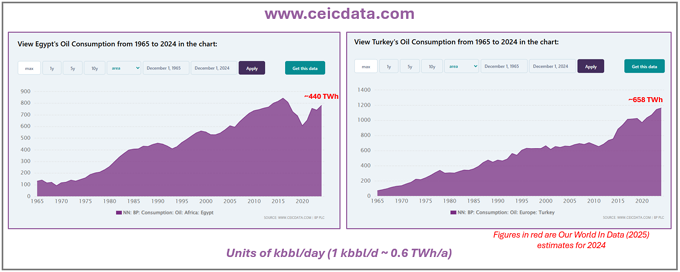
Figure 11
What can we say in conclusion then? As per Figure 1 it is impossible not to note that there has been an overall increase globally. At the same time we can observe across many regions that trends of decrease are not uncommon, even at continental scale, and that many big regional players have see a notable inflection point since at least 2015, with either onset of decline, undulatory plateaus, or much slower increase. The precise reasons for these seem many and varied according to the politics of each individual country. What seems apparent, is that when a crisis or inflection kicks in for any country affecting oil consumption, whatever the reason, what happens after it is different to what happened before. That suggests that these events when they occur, whatever form they take in individual countries, frequently shift outlooks away from oil to increasingly competitive alternatives.
What is certainly the case is that while a narrative of “oil demand continues to grow” is nominally true for now at global level, it is driven by mainly growth in rapidly accelerating Asian economies, and the wider story in countries around the world, including many bigger countries of Asia, is very different to that mantra. In many it has been so for a considerable length of time. So the question arises of which trend is the leading one. Something we will examine a bit more in a later section.
Oil production
It is not the intention to go into the same level of detail for production as for consumption but let us again take a look at the regional trends. This is to acknowledge that whatever demand trends are, they are not expanding into some limitless production unconstrained universe, they operate within constraints of resource availability, cost of production, and cost of distribution including any geopolitical vulnerabilities that involves.
We see the summary in Figure 12, again using the data and approach of Our World in Data (BP, 2022; Ritchie et al., 2025b, 2025c, 2025a, 2025d). What is immediately apparent is that in terms of production, only one region was still increasing on past peaks as of 2024, and that was North America. Europe peaked production in 1999, Africa in 2008, Asia Pacific and Central & South America both in 2015, the Middle East in 2016, CIS in 2019. Of these Central and South America has shown a bit of a trend reversal since 2021, largely thanks to Suriname and ongoing efforts of deep offshore Brazil. Elsewhere the plateaus, though stubborn, seem steady in gradual decline.
Even in North America there was an early 1985 peak and a decline in production until about 2008. This, when the onshore unconventional (fracking) efforts started to kick in, accompanied by renewed efforts in the deep Gulf of Mexico (GOM).
Despite the presence of unconventional resources in other parts of the world, there has been little effort to replicate US efforts on the fracking front in other regions. It has occurred, notably in China and in Argentina, but at nowhere the same scale. This seems largely driven by the availability of cheaper conventional oil from the Middle East and other areas. The strategic imperative for domestic supply and willingness to pay higher production costs to get it has been strongest in the USA and stronger and more practical than it seems to have been elsewhere. In the current political climate of the USA, the trend for ongoing fracking production seems likely to continue, but it remains vulnerable to any future changes in administration & policy and appears to have few imitators in other regions.
Any country that encounters any sort of crisis impacting oil consumption, will be looking at these production trends for guidance when it comes out of that crisis.
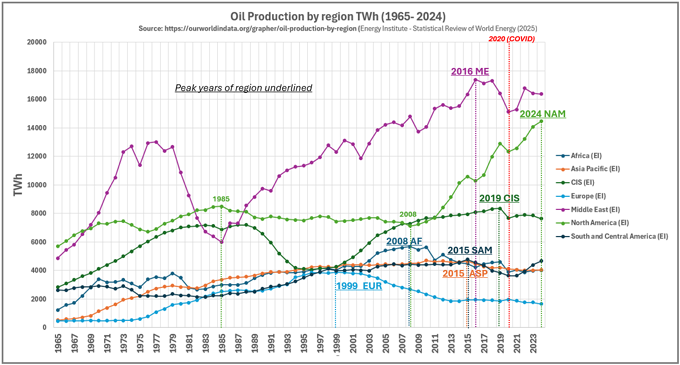
Figure 12
Gas consumption
It would be unreasonable to look at oil in isolation, since gas is increasingly touted as a “cleaner” alternative. It is only clean in an emissions perspective when compared with oil or coal, and they are no longer the only alternatives in town for a wide array of uses, however, labels aside, let’s look at the data.
Undoubtedly, the growth is more bullish than for oil, with North America and Asia-Pacific dominating growth, but with the Middle East in a strong third position (Figure 13). All these regions are currently increasing gas consumption, perhaps reflecting uses that are less vulnerable to ongoing changes in transportation and other easier to abate applications. Nevertheless, we still see peaks in consumption already occurring for Europe (2008), Central and South America (2015) and Africa (2008). The two latter past “peaks” are a little more ambiguous than the European decline which is steady since 2008. Note the scale in TWh is roughly half that use for the equivalent oil consumption chart. It is clear then that gas consumption remains more stubborn to shift than oil consumption, for now at least, but that by no means is everyone increasing.
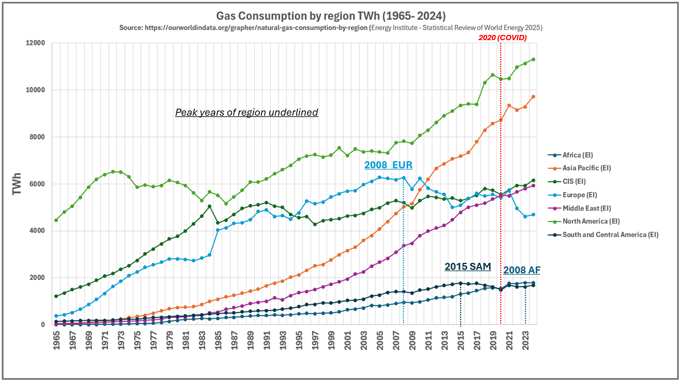
Figure 13
Gas production
It might be tempting looking at gas consumption to think, well OK, it is on a much more predictable course for ongoing increase, but like oil it is subject to all the same constraints of production. Noting importantly that these are not just constraints of resource availability. There is a lot of gas resource still left, just as there is for oil. The constraints are more of its cost competitiveness, and EROI competitiveness against alternative options that are proliferating across many sectors. More on EROI shortly.
As we see in Figure 14, many regions have already peaked for gas production, including Europe in 2004, Central and South America in 2017, Africa and CIS in 2020. North America, Middle East and Asia-Pacific however, continue to grow, though in the two latter, the rate of increase has been slightly decelerating since around 2015. As for oil, the willingness of North America to pay for and develop home-grown unconventional resource has been a strong player in the production increases. A slow down in 2024 is probably too early to interpret meaningfully, given US encouragements of its domestic hydrocarbon industry, but coming years will be interesting to see if momentum is sustained.
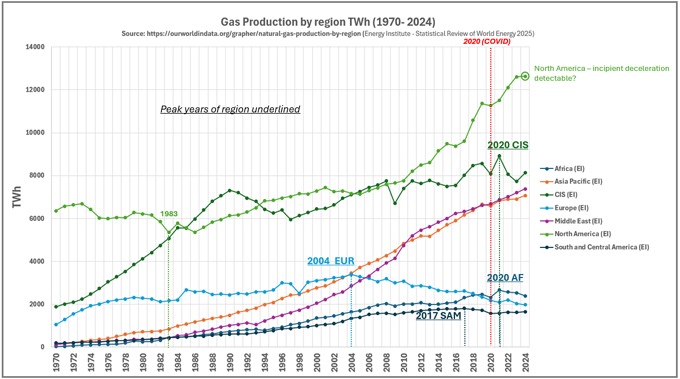
Figure 14
Lest we forget – impact…
Lest it needs saying, another constraint is the global desire to reduce emissions for air quality and climatic impact mitigation. That does not go away, and also needless to say, it influences decisions in some countries more than others. Increasingly for megacities in much of Asia and Africa and Central and South America, it is air quality issues – particularly when accompanied by protracted “becalmed” heat waves – that are forcing issues.
Price and EROI
The complexities of hydrocarbon price fluctuations are a subject to flummox a lifetime of study – but suffice to say the production cost of a barrel of oil or a cubic foot of gas is a strong driver on how competitive they are against alternatives. The production cost tends to go up in countries where the oil and gas basins are very “mature” like most of North America, East Asia, and Europe. Meanwhile production costs for the best quality hydrocarbons in the Middle East and Russia remain relatively low – which brings about discussions of geopolitics and how readily countries are to rely on international production from a diversified raft of different countries, compared to more expensive domestic production.
Different countries will value domestic production differently, but all we need say on this front is that the differential can be large – a factor of five in some cases. So there has to be compelling reasons for sticking with domestic production in countries with relatively expensive production. They can exist, and each country addresses this issue individually. The declining domestic production of mature basins might be more secure for some portion of total consumption, but with the vast wealth of resource in the Middle East and Russia, it is rarely cheaper, even with distribution costs included.
It is then a bit of a forlorn pastime to even try and attempt predictions of oil and gas prices. So often these things are dominated by short term geopolitical or natural events that are nigh on impossible to predict. What we can reliably predict are trends in EROI, or the energy return on invested for hydrocarbon recovery. Roughly speaking, this measures how much energy we get out of recovering hydrocarbons, for the energy we put into it. We want to make a significant energy profit for it to be worthwhile. It is of no gain from an energy perspective to be spending as much energy on getting something as it gives. EROI is not directly related to price, given the dominance of so many other complexities, but in the long term it is a big component of it. How much energy it costs us to do something is a big driver of the costs of anything we do.
We can then look at EROI evolution with time for oil and gas extraction, and what we see fairly compellingly is that it gets lower, and that’s bad news. A vigorous discussion in recent years has been comparing the EROI’s of oil and gas and nuclear and renewables, and we won’t treat that here, but a more detailed discussion is given in a previous article: www.linkedin.com/pulse/just-how-far-along-transition-we-part-4-eroi-swings-general-waters-nrq2e.
Suffice to say that renewables are increasingly in a position to be competitive with oil and gas on this metric (Aramendia et al., 2024). More importantly for oil and gas, whatever the absolute value of EROI for oil and gas against competitors, we see the trend in its own EROI with time is clear (Cleveland, 2005; King, 2010; Murphy, 2014; Murphy et al., 2022; Murphy & Hall, 2010). Things like deep offshore and unconventional production, and LNG involve significantly more energy to produce and distribute and drive down EROI. This impacts price, as per Figure 15 (Heun & de Wit, 2012).
So as we see in the “consumption crises” events that characterise oil consumption, the robustness of oil or gas to recover from such crises in the future will steadily diminish, even while EROI trends for the alternatives are often gradually improving.
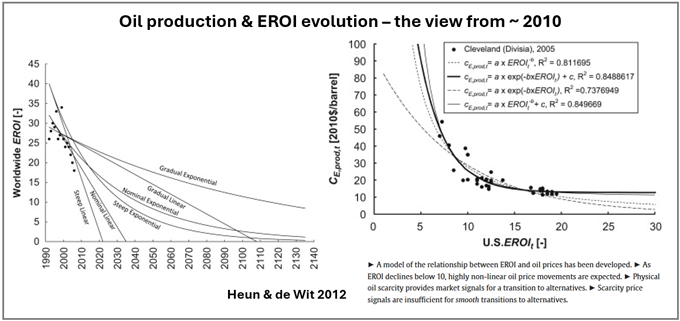
Figure 15
Unconventionals versus deep offshore versus international versus O&G alternatives
Our discussion shows that every country in the future, when faced with “bottlenecks” in supply of energy will be face with decisions of increasing complexity. If we assume for a minute that demand is assumed to remain constant or increase, the list of options is limited. In countries that no longer have abundant cheap-to-produce domestic hydrocarbons, which is most countries, the choices amount to 1) opting for domestic but more expensive deep offshore or unconventional resource, or 2) cheaper internationally supplied conventional supply, or 3) increasing options from nuclear and renewable alternatives.
Implicit in this decision making, is the awareness of the ongoing air quality and climate impact context, and the simple fact that sticking with the hydrocarbon route strategically is a “kicking the decision can down the road” since eventually even for deep offshore and unconventional options, price or availability constraints will be met.
Active demand reduction, the changing role of hydrocarbons, and what will stay “hard to abate”
Choosing which energy source to replace hydrocarbons is not the only choice before countries. Our entire national infrastructures have evolved over the last few centuries based on fossil fuels. Changing them to optimise for other things does not happen within the space of electoral terms. It takes many decades. Without pretending to present an exhaustive list, there are things that can be targeted to reduce oil and gas demand. Some of the big ticket items include:
- Greater reliance on the local non-fossil energy we have around us going unused;
- Efficiency offensives;
- Changing the modes on industrial process heating and land borne transportation networks including but not just electrification;
- Agricultural and horticultural practices including less dependence on fertiliser;
- New-build urban planning;
- Recycling and product longevity offensives;
- Energy storage and distribution networks (including long distance), for heat and power;
- Smart demand management including placement of strategic industries close to resource supplies that are compatible with their own demand versatility, or lack of.
- Not to mention being more aware to the sheer energy profligacy with which we tackle things sometimes, often unthinkingly.
The list could go on, and there are many others. These things are not cheap and the up-front capital investments may take some decades to payback – but that is not so very different from some of the big energy supply projects mooted. The real transformations in oil and gas demand will come not with more solar panels or wind turbines, but when things on the checklist above are planned at national scale, with multi-decade foresight. That is not far-fetched as it sounds, many countries have already embarked down that route. Not all…but success wherever it occurs, perhaps in the most “at first glance” unlikeliest of places, will be contagious.
We tend to get very focused on the so called “hard to abate” hydrocarbon uses that are difficult to find alternatives for. Some of them are listed in Figure 16 along with links to some abatement routes various organisations are considering.
It is undeniable some things will remain hard to abate for quite a long time. Long haul aviation for example is hard to provide for without reliance on hydrocarbons, with their lovely combination of being energy dense and relatively light in weight. Perhaps the routes for providing hydrocarbons may increase – such as biofuels and synthetic sustainable aviation fuels, but what we need to observe is that some reliance on hydrocarbons for the very hardest to abate things is not the end of the world.
Very few are insisting on a total avoidance of combustive use of hydrocarbons. The IPCC initial target has been 80% reduction. We can aim higher than that on some long time scale, but we can note that if we still rely on 10% of our energy from hydrocarbons at some point in the future, we still will have made great strides from now. It seems likely, that gas will continue to play a role in reserve back up for power supplies to cover increasingly rare instances when alternatives can't support the grid, as they expand into the long term future.
The story then is not one of relegating hydrocarbons to zero value, it is of thinking clearly about the roles we will continue to want them for in a world where day to day energy is no longer dominated by them. Non-energy uses like petrochemicals and fertilisers, or reserve power and heat back-ups for what renewables plus/minus nuclear can’t deliver, will linger.
One of the interesting things to watch though is the industrial heat processes that have historically relied on hydrocarbons or coal. Steel and cement amongst the two biggest-hitters but also including things like glass & paper. There is a lot of movement on various alternatives to these things that are often understated – many of them electrical in nature, others reliant on more sustainable combustion like biomass or biofuels (Friedmann et al., 2019).
Admittedly some of these are expensive on current day economics and still facing technical issues. The proliferation of alternatives however is undeniable, and competitiveness may well improve with economies of scale, and as the EROI of oil and gas options continues to decrease. The things we will call hard to abate in the future will be a smaller subset of what we regard as hard to abate today. More discussion on these topics can be found here:
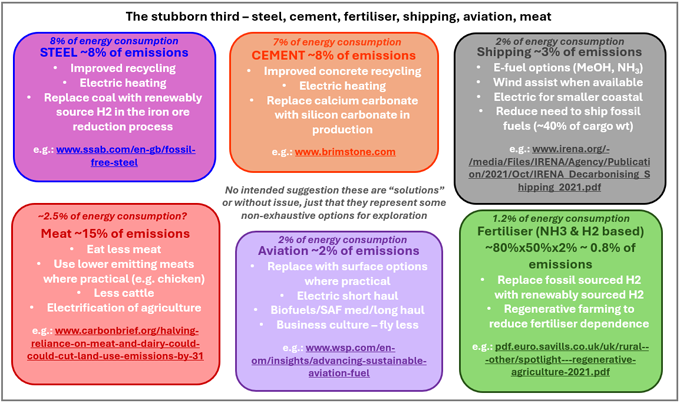
Figure 16
Concluding comments
There is a very common tendency to say somewhat blithely “oil and gas demand continues to grow”. The simple intention of this article has been to illustrate that although at global level it's not overtly untrue, when we mine the detail at regional levels, the story is in fact far more nuanced. Furthermore, that historical trends of decline or plateaus observed in many countries and regions, might be expected to become a feature of other countries in the future.
The alternatives steadily proliferate, and the incentives to explore them steadily increase. Wherever we hear that “oil and gas demand continues to grow”, the data herein should cause at least a bit of a “yeah but…” in our minds. That is not to predict what will happen in June 2028, or May 2035, but it is to note that there are some fundamentals that we can expect to manifest by 2045.
Most importantly though, we are not sitting ducks at the mercy of some great monster we call demand.
The amazing thing is really how much decline or plateauing has “spontaneously” occurred in various parts of the world, without very much proactive design to reduce oil and gas demand. It begs the question as to what could be achieved if truly “joined-up-thinking” and long term initiatives could be planned. Not without duty of care to existing industries and those employed by them, but with clear thinking of the changed role/emphasis hydrocarbons might have in a totally different future energy landscape.
As trends shift in all the options, there are very proactive steps any country can take to reduce oil and gas demand in the long term. Choices not really relying on bans or prohibitions, but on providing choices that work better for a population. It is a decision choice to do so, not some law of the universe we have to bust. There are physical laws of the universe, but for most of the things we do, there are alternative routes, and the questions are more ones of economics than of physics. The economics is rooted in what we value, and global values are changing.
References
Aramendia, E., Brockway, P. E., Taylor, P. G., Norman, J. B., Heun, M. K., & Marshall, Z. (2024). Estimation of useful-stage energy returns on investment for fossil fuels and implications for renewable energy systems. Nature Energy, 9(7), 803–816. https://doi.org/10.1038/s41560-024-01518-6
BP. (2022). Approximate conversion factors Statistical Review of World Energy. https://www.bp.com/content/dam/bp/business-sites/en/global/corporate/pdfs/energy-economics/statistical-review/bp-stats-review-2022-approximate-conversion-factors.pdf
Cleveland, C. J. (2005). Net energy from the extraction of oil and gas in the United States. Energy, 30(5), 769–782. https://doi.org/10.1016/j.energy.2004.05.023
Energy Institute (EI). (2025). Statistical Review of World Energy 2025 | 74 th edition In collaboration with. www.energyinst.org/statistical-review
Friedmann, S. J., Fan, Z., & Tang, K. E. (2019). Low-carbon heat solutions for heavy industry: Sources, options, and costs today. www.sipa.columbia.edu
Heun, M. K., & de Wit, M. (2012). Energy return on (energy) invested (EROI), oil prices, and energy transitions. Energy Policy, 40(1), 147–158. https://doi.org/10.1016/j.enpol.2011.09.008
King, C. W. (2010). Energy intensity ratios as net energy measures of United States energy production and expenditures. Environmental Research Letters, 5(4). https://doi.org/10.1088/1748-9326/5/4/044006
Murphy, D. J. (2014). The implications of the declining energy return on investment of oil production. In Philosophical Transactions of the Royal Society A: Mathematical, Physical and Engineering Sciences (Vol. 372, Issue 2006). Royal Society. https://doi.org/10.1098/rsta.2013.0126
Murphy, D. J., & Hall, C. A. S. (2010). Year in review-EROI or energy return on (energy) invested. In Annals of the New York Academy of Sciences (Vol. 1185, pp. 102–118). Blackwell Publishing Inc. https://doi.org/10.1111/j.1749-6632.2009.05282.x
Murphy, D. J., Raugei, M., Carbajales-Dale, M., & Estrada, B. R. (2022). Energy Return on Investment of Major Energy Carriers: Review and Harmonization. In Sustainability (Switzerland) (Vol. 14, Issue 12). MDPI. https://doi.org/10.3390/su14127098
Ritchie, H., Rosado, P., & Roser, M. (2025a). Natural Gas Consumption by Region. https://ourworldindata.org/grapher/natural-gas-consumption-by-region
Ritchie, H., Rosado, P., & Roser, M. (2025b). Natural Gas Production by Region. https://ourworldindata.org/grapher/natural-gas-production-by-region-terawatt-hours-twh
Ritchie, H., Rosado, P., & Roser, M. (2025c). Oil Consumption by Region. https://ourworldindata.org/grapher/oil-consumption-by-region-terawatt-hours-twh
Ritchie, H., Rosado, P., & Roser, M. (2025d). Oil Production by Region. https://ourworldindata.org/grapher/oil-production-by-region
Original article l KeyFacts Energy Industry Directory: Paetoro Consulting