
David Bamford, Director at IMMER Ltd
Les Antony has published a remarkable analysis, based entirely on public data, of the Stabroek Block, offshore Guyana, for the current 4 FPSOs - oil production profiles, recycled and flared gas, voidage replacement, early decline onset for Liza 1, and so on.
The graphic below is his pie chart for the nearly 1 Tcf of gas produced from 12/2019 to 09/2025:
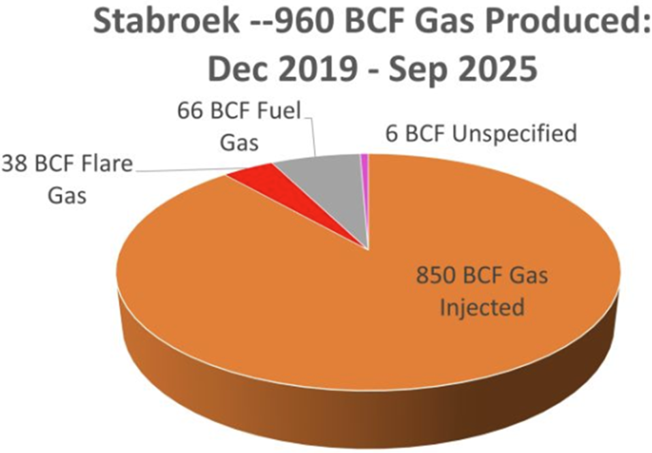
Assuming the ‘unspecified 6 Bcf’ is emitted, either by venting or leakage, then we can say that of 960 Bcf:
- Flared Methane is 38 Bcf ie an intensity of 3.96%
- Methane Emissions 6 Bcf ie an intensity of 0.63%
- for an overall ‘wasted methane’ intensity of 4.59%.
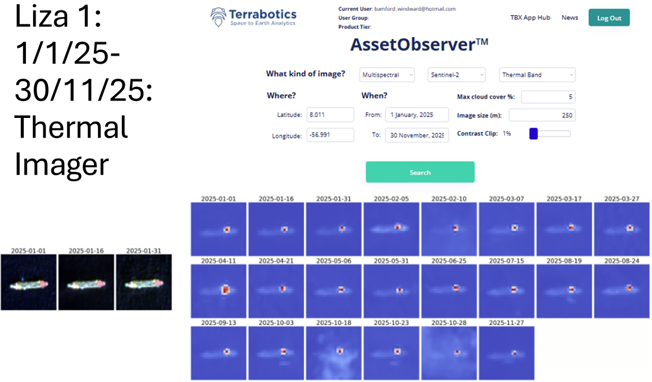
Both flaring and emissions are readily observable by satellites.
The two Sentinel-2 thermal images below show 2025 flaring from the Liza 1 and Yellowtail FPSOs (to the left are radar images of each FPSO):
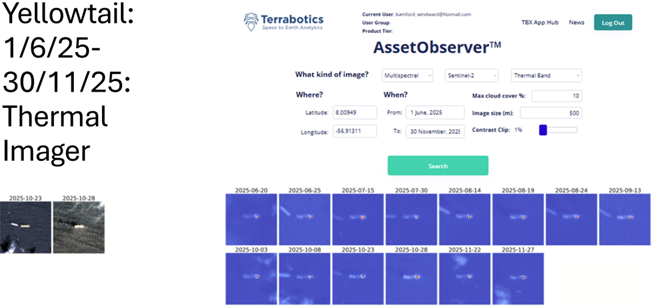
And I note that Carbon Mapper obtained a methane ‘plume’ image from Yellowtail on 29th September 2025 and estimated the emission rate to be 2,700 kg/hour.
The combination of ‘bottom-up’ computations using public data and satellite images gives a credible ‘whole basin’ estimate of intensities.