David Bamford
Director at Future Energy
A good visual record of so-called SuperEmitters in the UK and the EU is contained in this Terrabotics Emissions Analyst graphic:
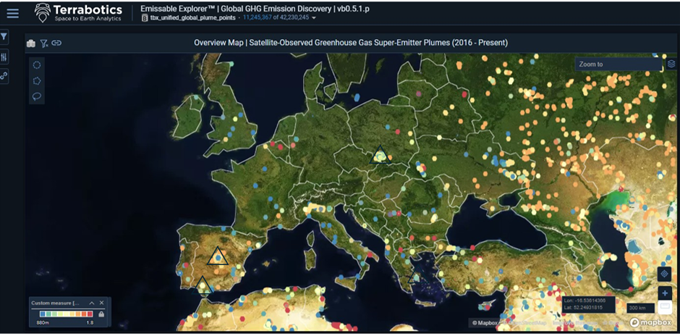
What is shown are all the Plumes imaged by various satellites from IMEO, Carbon Mapper, GHGSat etc.
It’s worth noting that the Plumes shown in Russia are from the pipeline system feeding gas into the EU – I’ll return to the issue of leaky gas pipeline systems in a later Article.
For my own sanity, I have then narrowed the definition of a SuperEmitter to a source that has been visited multiple times, often by different satellites; and reviewed the 4 that are picked out by the black triangles in this image: two in Spain (one near Seville, one near Madrid), one in Greece (near Athens) and two in western Poland.
The first 3 are associated with Landfills, the Polish ones are associated with Coal Mines. Here are the images:
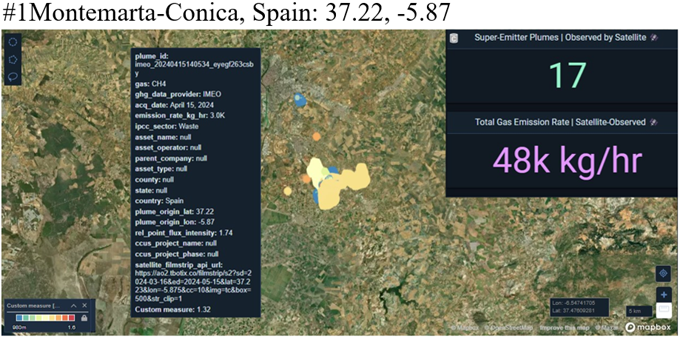
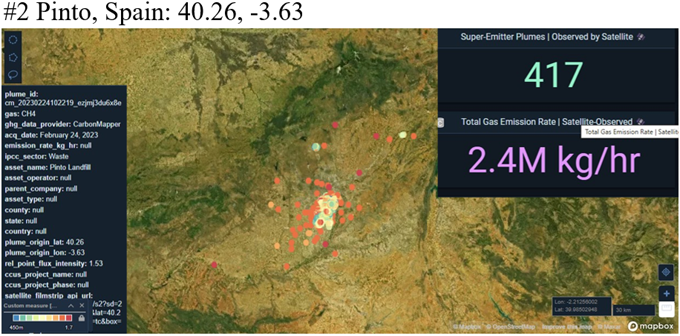
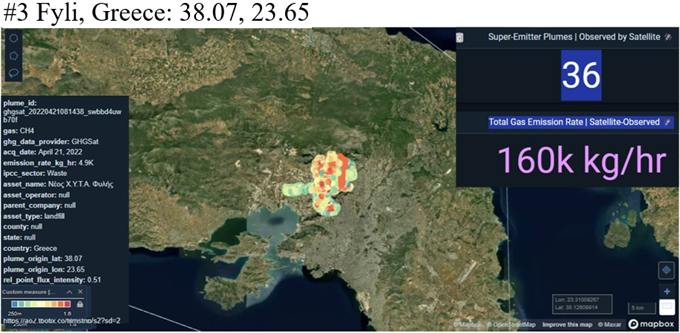
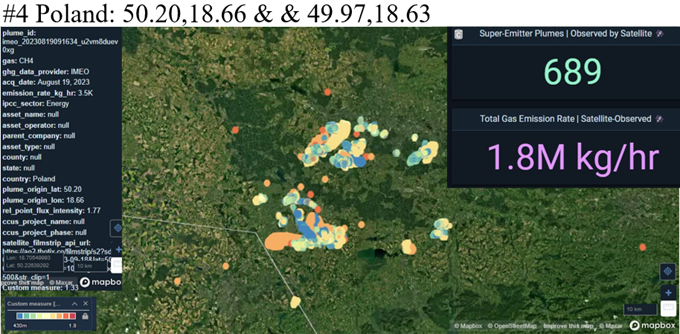
In each case, the information to the right tells you how many individual Plumes have been observed, and the summed total of the observed methane emissions – I leave it to the reader to figure out an average daily rate!
The information to the left simple summarizes the satellite, the location, date, volume estimate etc for one of the Plumes.
Really interesting ‘spot’ observations – but that’s what they are, observations made on a particular day at a particular time. They do not give continuous measurements, they do not represent Continuous Monitoring.
KeyFacts Energy: Commentary