European supermajors BP and Shell occupy the top spots on opposite sides of Rystad Energy’s M&A ranking for the oil and gas sector during the last five-year period.
Rystad Energy has analyzed the share of resources traded globally from 2015 through July 2019. Two oil and gas companies stand out in the tally, not including the outlier deal between Occidental and Anadarko in May this year:
- BP has seen the most resource growth from mergers and acquisitions (M&A) across all supply segments, adding nearly 6.5 billion barrels of oil equivalent (boe).
- On the sell side, Shell tops the list by a wide margin. The Anglo-Dutch company has shed almost 11 billion boe since 2015 (excluding the effect of Shell’s 2015 acquisition of BG Group).
“The majority of BP’s shale and tight oil resource growth in recent years was attained through the acquisition of BHP’s upstream assets in the US last year,” says analyst Ilka Haarmann on Rystad Energy’s Upstream team. “On the other side of the spectrum, Shell divested significant resources from all supply segments after it acquired BG in 2015.”
Top 10 companies with net inorganic resource growth*
Million barrels of oil equivalent, 2015 to July 2019
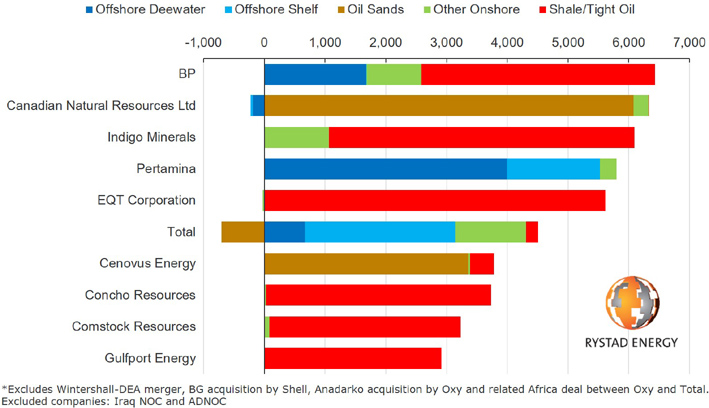
Source: Rystad Energy UCube, Rystad Energy research and analysis
Top 10 companies with net inorganic resource reduction*
Million barrels of oil equivalent, 2015 to July 2019

Source: Rystad Energy UCube, Rystad Energy research and analysis
Learn more about UCube.
The global average value of announced oil and gas asset transactions is an important indicator of market activity. In the first half of 2019, the total deal value sky-rocketed thanks to Occidental’s $57 billion acquisition of Anadarko. However, the massive Oxy-APC transaction is a clear outlier. Excluding this deal, Rystad Energy’s monthly M&A rapport shows that the monthly average in the first half of 2019 was just $7 billion, down 37.5% from the corresponding period last year.
Monthly deal value by continent*
Billion USD
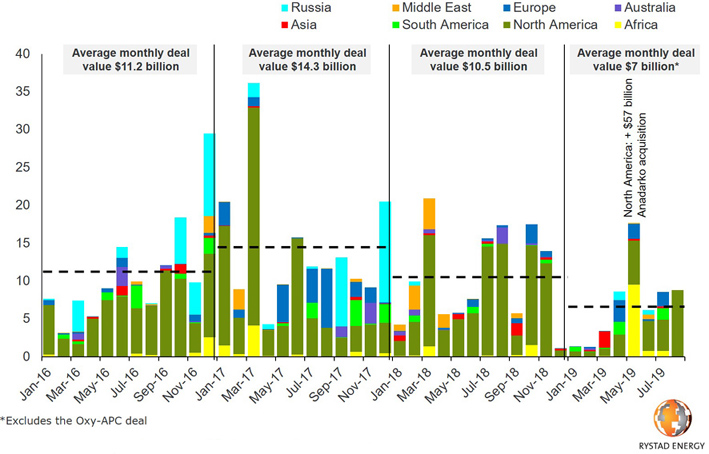
Source: Rystad Energy UCube, Rystad Energy research and analysis
“M&A activity is like a finger on the pulse of the upstream industry. And in recent months we have seen relatively low-value deals – the average tally pales in comparison to recent years,” Haarmann added.
Yet these numbers do not paint a complete picture of the M&A market, as the share of offshore resources traded has risen steadily since 2015.
Onshore resources, including shale and tight oil, accounted for as much as 54% of the traded resources in 2015 but has remained below 30% since 2016. Conversely, the ratio of offshore asset transactions has increased from 16% of traded resources in 2015 to more than 40% in 2018.
“As of July 2019, the share of offshore resources traded this year equaled the share of shale and tight oil resources traded,” Haarmann observed.
KeyFacts Energy Industry Directory: Rystad Energy