
David Bamford, Future Energy Partners Ltd
There is increasing suggestion that ESG performance leads to improved financial performance. The evidence is not irrefutable. However, for reputational purposes, if for no other reason, the European Oil Majors are putting increased effort into reporting their ESG performance, at least in terms of page count.
Reporting on ESG by all manner of companies is increasingly attracting coverage in the mainstream press. For example, The Times recently commented:
“There is a real danger that this kind of overinflated “greenwashing” undermines genuine efforts to drag markets into the fight against global warming, a danger that ESG becomes the financial world equivalent of the carmakers’ emissions testing scandal. It has all the same ingredients. A flawed measurement system, a weakness of independent verification, huge financial incentives. The only thing missing is regulatory recourse. Unlike VW, which paid $33 billion in fines and compensation for emissions rigging, there is no punishment for bad actors in green markets.”
6 European Majors (BP, ENI, Equinor, Repsol, Shell, Total)
If you are cynical, it’s easy to accuse the Oil & Gas Majors of “greenwashing” with respect to the Energy Transition in general and ESG reporting in particular. In 2020, I reviewed the 2019 Annual Reports and Sustainability Reports of BP and Shell. There was then very little detail on plans to deal with emissions and their commitment to Net Zero.
Once you get past the PR of the 6 European Majors and dig into the details one similarity and several real differences begin to emerge. The similarity is that heretofore almost nothing is actually measured – there is much extrapolation (and assumptions) from how equipment behaved in idealised laboratory tests.
There are many differences. For example, the components included in their respective Energy Transition ambitions vary greatly (which energy sources, what %, by when), the reporting of Greenhouse Gas Emissions (different units; only Scopes 1 &2, or 1, 2 & 3), what they are going to do to reduce to Zero Emissions (there's a difference between Zero and Net Zero, between absolute emissions and emissions intensity), how, and by when - 2035, 2040, 2050, 2060?
Accessing the 6 European Majors 2020 Reporting, we have extracted data to answer 4 questions for each company:
- What have they reported on emissions for 2020?
- Insofar as emissions performance shows improvement over a few years, is this reflected in Executives’ Remuneration for 2020?
- What are their plans wrt to emissions in the short term? In particular, are they going to measure, not just report?
- How will short term Executive Remuneration recognise (dramatic) improvements in emissions performance?
We will conclude with a 'traffic light' summary that begins to identify both “committed improvers” and potential “greenwashers”.
In their Annual and/or Sustainability Reports for 2020, the six European Majors and mini-Majors – referred to as companies A – F in this summary - have reported on their emissions for the year. It is important to remember that the majority of the reported numbers are not measured but are calculated on the basis of idealised laboratory experiments with compressors, turbines, flanges, joints etc.
Overall these numbers are interesting only up to a point: broadly speaking companies A, C E and F report to the same extent and quantification, B and D less so. Some of the numbers are very large – for Flaring and Scope 3 Emissions for example.
As a next step, it’s reasonable to ask:
- As there have been improvements in reported emissions year-on-year (progress since 2016 is a common theme), to what extent is this recognised in 2020 Executive Remuneration?
- What improvements are promised in the short term, say over the period 2021 – 2023?
- To what extent will these improvements (or lack of them) impact Executive Remuneration over the same period?
Again, 2020 reporting yields answers to these questions. An honest summary would be that many of these answers are qualitative, short on detail, and deploy ‘trust us’ quite often.
Thus much of what is reported next is a subjective assessment where the following colour code has been used:
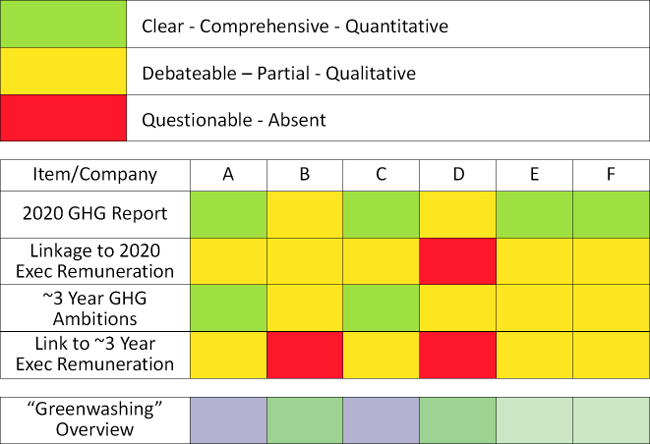
None of these 6 companies are perfect but it is possible to group them into 3 based on this year’s reporting:
1. Companies A and C – technically clear, soon-to-be-measured, emissions targets; commitment to measure progress against these targets; some accountability in Executive Remuneration.
2. Companies E and F – ‘more of the same’ based on improvement in numbers that are stated, not measured; much left to ‘judgement’ of Remuneration Committees.
3. Companies B and D - ‘more of the same’ based on improvement in numbers that are stated not measured; unclear/absent accountability visible in Executive Remuneration.
and on this basis the “greenwashing overview” recognises a couple of “committed improvers” – in blue – and uses shades of “green” for the others.
This analysis begins to differentiate between these 6 European Majors – offering competitive advantage to some, competitive disadvantage to others, in the sense that investors can begin to make informed choices.
7 E&Ps (Diversified Gas & Oil, Energean, Jadestone Energy, Savannah Energy, SEPLAT Petroleum, Serica Energy, Wentworth Resources)
The Major Oil & Gas companies (Exxon, Chevron, BP, Equinor, Total, Shell etc) have adhered to the proposition that gas will be a major component of the (coming sooner or later to a screen near you) Energy Transition. Recognizing that the amount of gas that is flared, ‘vented’ or is ‘fugitive’ represents an Achilles Heel for this story, there has been a great deal of signaling along the lines of ‘trust us, we are dealing with these issues’. However, when you dig into the details, the promises that are being made by some companies do not stand up to scrutiny.
Recently, the industry has received a couple of significant shocks.
First of all, activist investors have succeeded at the very least in deeply questioning Exxon and Chevron’s respective ‘climate change’ plans.
Secondly, a court in the Hague ruled that Shell’s emission reduction plans were inadequate commenting that its policy was “not concrete, has many caveats and is based on monitoring social development rather than the company’s own responsibility for achieving a CO2 reduction”. Actually, this is a very good depiction of their bland, more of the same, ‘trust us’ plans, all rooted in this blah about ‘being led by societal trends’!
All this has sent a shock wave through not only oil & gas companies but also purchasers of gas. Having discussed this with several industry colleagues, the consequence we believe will be a quest for ‘Responsibly Sourced Gas’, ‘Sustainable Gas’ i.e. gas which is ‘flaring and emissions free’; which will have to be certified as such by accredited professional firms that can verify the amount of emissions and, that if necessary, will stand up in a court of law.
Isn’t it then reasonable to ask what E&Ps that are focused on gas have to say about these issues?
I have accessed the 2020 Reports of the aforementioned 7 E&Ps and extracted data to answer the previously summarised questions for each company and again conclude with a 'traffic light' summary that begins to differentiate these 7 companies, one from another.
In their Annual and/or Sustainability Reports for 2020, the seven – referred to as companies A – G in this summary - have reported on their emissions for the year.
It was hoped that these companies reported on Scope 1 and 2 total GHG (CO2e) Emissions, CO2 and CH4 Emissions separately, Scope 3 GHG Emissions (from sale of production) and flare volumes. In fact none of them reported on all of these metrics – some only reporting on two of them, and the overall pattern is completely inconsistent. Disappointing!
Again, with respect to future plans and executive remuneration, it was hoped that 2020 Reporting should yield answers to these questions. However, an honest summary would be that many of these answers are qualitative, short on detail, and deploy ‘trust us’ quite often; some seem simply focused on Business As Usual.
Thus much of what is reported next is a subjective assessment where the following colour code has been used:
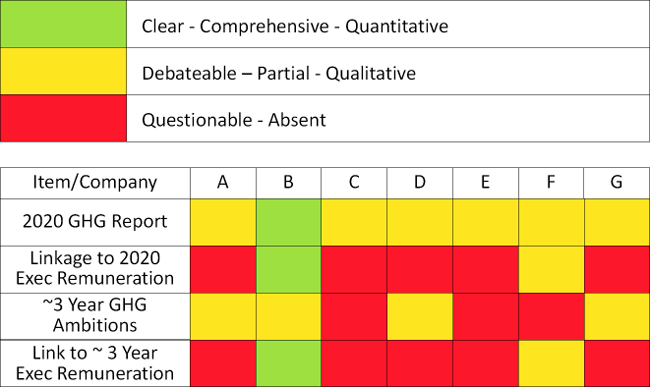
These seven companies can, based on this year’s reporting, be differentiated as follows:
4. Company B – technically clear, measured, emissions targets; commitment to measure progress against these targets; accountability in Executive Remuneration.
5. Companies A, D, F, G – ‘more of the same’ based on improvement in numbers that are stated, not measured; much left to ‘judgement’ of Remuneration Committees.
6. Companies C and E – Business As Usual?
Summary
The quality of Reporting for 2020 varies from good to poor even abject.
Two Majors and one E&P are clearly ‘trying hard’; a few are simply saying ‘trust us’; a few are just pursuing Business As Usual.
And…
It is important to remember that the majority of the reported numbers are not measured but are calculated on the basis of idealised laboratory tests with compressors, turbines, flanges, joints etc.
KeyFacts Energy Industry Directory: Future Energy Partners