David Bamford
Director at Future Energy Partners/Publishing
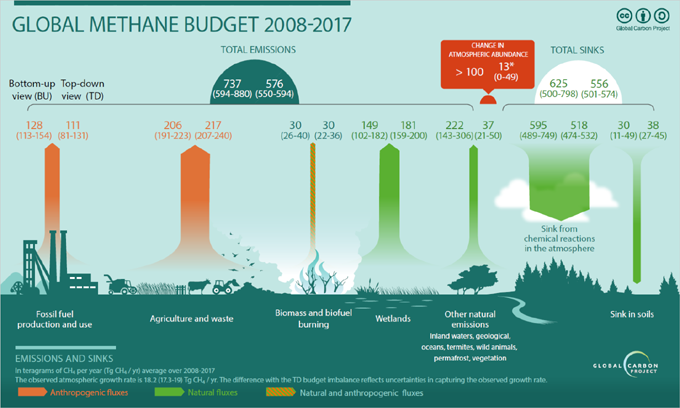
This really useful graphic comes from The Global Methane Budget 2000-2017 (2020) and is much more useful than anything the IEA has produced….but more on them in a moment.
https://www.globalcarbonproject.org/methanebudget/20/publications.htm
All these numbers come with significant problems either because they are based on idealised laboratory experiments, modelling in atmospheric physics, ‘estimation’. Historically there has been almost no actual measurement and currently there is very little.
Bypassing the difficulties of establishing a budget for ‘Agriculture and Waste’, I want to focus on ‘Fossil Fuel production and use’ and ‘Wetlands’.
With respect to ‘Fossil Fuel production and use’, in its 2022 Global Methane Tracker, reporting on 2021, the IEA states that:
“We estimate that the global energy sector was responsible for around 135 million tonnes of methane emitted into the atmosphere in 2021. Following the Covid-induced decline in 2020, this represents a year-on-year increase in energy-related methane emissions of almost 5%, largely due to higher fossil fuel demand and production as economies recovered from the shock of the pandemic.
The inclusion in the Global Methane Tracker of country-by-country estimates for coal activities, alongside those for oil and gas operations, makes the People’s Republic of China (hereafter “China”) the largest source of global energy-related methane emissions, with 28 million tonnes (Mt), followed by Russian Federation (hereafter “Russia”) (18 Mt) and the United States (17 Mt).
The energy sector is responsible for around 40% of total methane emissions attributable to human activity, second only to agriculture. Of the 135 million tonnes of energy-related emissions, an estimated 42 Mt are from coal mine methane, 41 Mt from oil, 39 Mt are from extracting, processing and transporting natural gas, 9 Mt from the incomplete combustion of bioenergy (largely when wood and other solid biomass is used as a traditional cooking fuel), and 4 Mt leaks from end-use equipment.
The wasteful leakage of methane, the main component of natural gas, is all the more striking given today’s backdrop of very tight and volatile gas markets. Methane leaks in 2021 from fossil fuel operations, if captured and marketed, would have made an additional 180 billion cubic metres of gas available to the market, an amount similar to all the gas used in Europe’s power sector.”
https://www.iea.org/reports/global-methane-tracker-2022/overview
Thus the Oil & Gas Industry and the so-called Foundation Industries – steel, cement, brick making, construction etc - are under intense scrutiny regarding GHG Emissions and Flaring:
Their Public Reporting as found in Annual Reports, Sustainability Reports, sometimes on Websites – based on Future Energy Partners’ reviews – can be summarised as:
- Majors = Reasonably comprehensive but diverse, heterogeneous
- E&Ps = with one or two exceptions, partial, incomplete, non-existent
- ‘Foundation Industries’ = indistinguishable from E&Ps
and, where numbers are actually quoted, typically describes ‘Bottom-up’ Reporting that is usually based on ‘engineering estimates’, not operational measurements. However, this is going to have to change…..
Of all locations, the Permian Basin of Texas and New Mexico is the one most under the spotlight:
And yet, under-reporting by companies operating there – not just by a few % but by at least several 10s of %, sometimes much more, is widely observed in work by independent bodies (using satellites, fixed wing aircraft etc).
By extrapolation, we might assume that under-reporting of GHG Emissions is a problem across all industries….resulting in 2 key questions:
- How can a company Measure - and thus accurately Report - Operated (and Equity) flaring and GHG emissions?
- How can a company accurately document – and report – GHG emissions within its Supply Chain?
Without reliable measurement, how can Mitigation plans and promises be assessed and believed, let alone delivered?
As shown in the above graphic, ‘Wetlands’ are the biggest natural source of methane emissions. When it comes to actual numbers, the common reference is to 167Mt as per the above referenced Global Methane Budget although figures published by the IEA in 2021 indicate more than 190Mt.
With regard to Wetlands, a key recent paper is ‘Large Methane Emission Fluxes Observed from Tropical Wetlands in Zambia’, in which the authors state that:
” In this work, we use the first airborne measurements of CH4 sampled over three wetland areas in Zambia to derive emission fluxes.
Three independent approaches to flux quantification from airborne measurements were used:
airborne mass balance, airborne eddy-covariance, and an atmospheric inversion.
Measured emissions (ranging from 5–28 mg m-2 hr-1) were found to be an order of magnitude greater than those simulated by land surface models (ranging from 0.6–3.9 mg m-2 hr-1), suggesting much greater emissions from tropical wetlands than currently accounted for.”
https://doi.org/10.1029/2021GB007261
Finally, returning to ‘Fossil Fuel production and use’, the Times recently reported that “Methane leaks from Australian coal mines are double official estimates” – a claim that Glencore, the operator/owner of the mine in question has denied. There’s more on Bloomberg: https://www.bloomberg.com/news/articles/2022-06-17/methane-spewing-coal-hubs-are-a-climate-change-test-in-australia
The key observation that unites the topics of ‘Fossil Fuel production and use’ and ‘Wetlands’, other than both being about methane emissions, is that measurement changes everything – typically measured values are significantly higher – from a few 10s of % to an order of magnitude – than arrived at by ‘engineering estimates’, ‘land surface models’, ‘official estimates’, and other assumption-riddled calculations…..
For Future Energy Partners’ Insights on measurement, please click here
KeyFacts Energy Industry Directory: Future Energy Partners