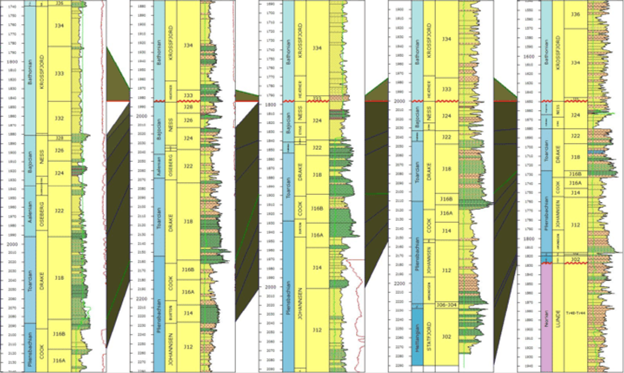
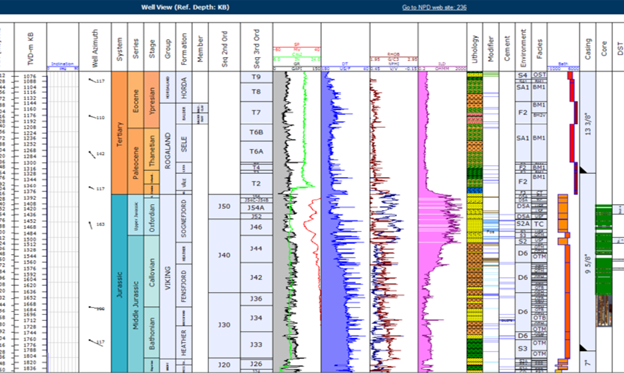
A best-in-class sequence stratigraphic geological interpretation and comprehensive well data suite, delivered within a user-friendly desktop browser.
Geographic Areas for FMB
FMB well and map datasets are delivered via our easy-to-use desktop browser, allowing users to query and visualize interpreted wells and facies maps, along with quick access to source data and a regional cross-border stratigraphic framework.

Available Regions
- Northwest Europe
- Eastern Canada
- Australia NW Shelf
- Offshore Brazil
- Mexico
Data Deliverables
- Interpreted Borehole Stratigraphy (Chrono-, Litho-, and Sequence)
- Gross Depositional Facies & Environment Maps
- Interpreted Lithology with Cement and Modifiers
- Environment of Deposition
- Associated Depositional Facies
- Paleo-bathymetry
- Conditioned Wireline Logs (GR, DT, DTS, NPHI, RHOB, ILD, SP and CAL)
- Mud Gas Chromatograph Logs (C1-C5 & Total Gas)*
- Deviation Surveys
- Calibrated Time-Depth Pairs and Synthetics
- Hydrocarbon Shows
- Geochemical Data*
- Biostratigraphy*
- Core & Casing Depths
- Core Analysis Data: Porosity, Permeability and Saturation(1)
(1) Some FMB data deliverables are region specific
Benefits of FMB

How Clients Use the FMB
- Understand regional basin and paleoenvironment evolution based on trusted data; a robust interpretation that uses industry-recognized best-practice methods that integrate well data, biostratigraphy, core and an extensive modern seismic database.
- Complete license round applications efficiently, support asset evaluations, hydrocarbon exploration and development, evaluate carbon capture and storage sites.
- Reduce risk through the delineation source, seal and reservoir facies for use in predictive exploration to develop play concepts and mature prospects.
- Cross-basin harmonized stratigraphic framework and nomenclature is ideal for cross-border exploration and improves communication in license group discussions.
- Leverage standardized databases in Advanced Analytics and Machine Learning programs to derive deep insights.
- Up-to-date geological insight; updated annually with newly released E&A wells, new data types from TGS digitization initiatives, interpretation upgrades and functionality enhancements.
A Robust Visualization Application
FMB data is delivered in an easy-to-use Desktop Visualization Tool, which includes a suite of integrated tools that allow the user to perform a range of visualization, manipulation, data analysis techniques, and exports.

The Application Includes
- Well Panel - Enables the visualization of well data in Single well, Multi-Well, and Geological Age (Wheeler) views.
- Glide Map - The interactive viewer for GDE and facies maps and tools for spatial data analysis of FMB data.
- Query Tool - It is an easy way to mine into the database, create custom queries and export data in industry-standard formats directly from the FMB database.
FMBConnect Web Services (API)
Use FMBConnect web services to incorporate FMB well and map data seamlessly into your workflows, applications and databases.
Seamless Integration
- Integrate FMB well and map data with your internal systems utilizing our RESTful web services to automate data management processes.
- Optimize productivity with integration of data across applications and access to up-to-date data for decision-making and technical evaluation.
- Integrate TGS data with proprietary and other 3rd party data to optimize workflows.
FMB Loaded to Petrel
Streamline data management workflows by leveraging the preloaded Petrel E&P software projects that include all the well-based FMB deliverables.
KeyFactsEnergy Industry Directory: TGS l KeyFacts Energy news: Products & Services
 KEYFACT Energy